EUR/USD analysis today: 8 setups invalidated before becoming active at 1.11822, 30 October 2026
Data as of 2026-10-29 20:59 UTC · Levels and zones: Znorva analysis engine
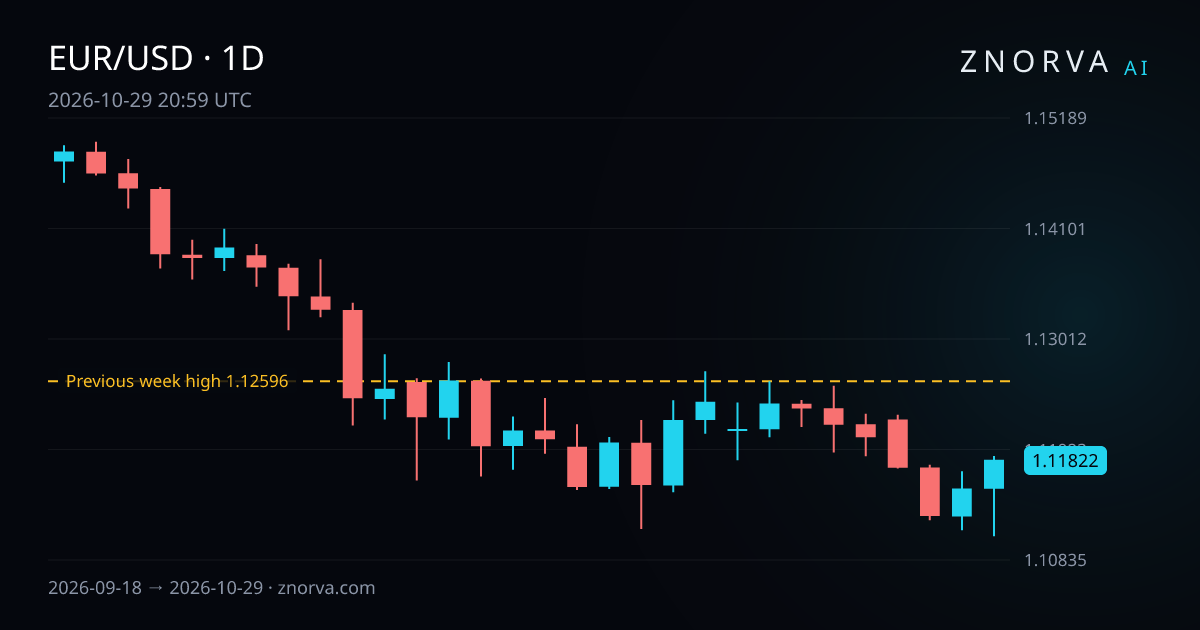
EUR/USD analysis today points to a market that moved higher on the day but still failed to confirm many model conditions. The main fact is simple: 8 model setups were invalidated before becoming active, with the daily close at 1.11822. This reading uses data stamped 2026-10-29 20:59 UTC.
EUR/USD price snapshot
EUR/USD finished 29 October 2026 with a daily close of 1.11822 after opening at 1.11537. The session high was 1.1186, and the low was 1.11068. That left the pair up 0.25% on the day, with a 0.71% session range.
The previous session, on 28 October 2026, closed at 1.1154. That means the latest close came in above the prior day, even though the intraday move stretched across both sides of the earlier range.
Across the last 7 sessions, from 21 October 2026 to 29 October 2026, EUR/USD moved from an open of 1.12373 to a close of 1.11822. That period ended at -0.49%.
The last 30 sessions, from 18 September 2026 to 29 October 2026, show a wider range between 1.14956 and 1.11068. The latest daily close sits much closer to that 30-session low than to the high, which helps explain why short-term rebounds have not translated into many valid model conditions.
For wider context on how these market reads are built, see Znorva's AI forex analysis.
Nearest reference levels and zones
The nearest reference levels in the current engine snapshot are both above the market. From the daily close of 1.11822, the previous week high on the 4H timeframe is 0.69% above, and that level sits at 1.12596. The previous month high on the 1D timeframe is 4.22% above, at 1.16538.
The engine also logged three downside liquidity sweeps on 29 October 2026. In each case, the reclaim window expired before the required confirmation appeared.
- Previous month low on the 1D timeframe: 1.13239
- Previous month low on the 1D timeframe: 1.13097
- Previous week low on the 4H timeframe: 1.11855
There are no active demand zone or supply zone readings in the current data. That matters because the engine is relying mainly on reference-level behavior rather than zone structure.
What changed since yesterday?
Compared with 28 October 2026, EUR/USD closed higher. The pair moved from a daily close of 1.1154 to 1.11822, which matches the reported daily change of 0.25%.
The session also pushed above the previous day's high and below the previous day's low. On 29 October 2026, the high reached 1.1186 versus 1.1171 on 28 October 2026. The low reached 1.11068 versus 1.11127 a day earlier. That wider push on both sides fits the 0.71% daily range.
In the last 24 hours, no nearest reference levels were touched. No new demand zone or supply zone appeared. No model setups became active, and no setups resolved under the model's rules. Instead, 8 setups were invalidated before becoming active. That is the clearest change in the latest update.
Model-tracked outcomes
Model-tracked outcomes are hypothetical analytical results, not executed trades or customer results. Znorva does not execute trades.
Over the last 30 days, the engine recorded 6 resolved setups in EUR/USD. All 6 produced a partial outcome. In plain terms, each one reached target 1 (TP1) and then resolved under the model's rules. None reached its final target. None resolved at breakeven. None resolved at the model's stop level.
The combined hypothetical model-tracked outcome for those 6 resolved setups was 4.93 R. R is the distance between the reference entry and the model's stop level. A result of 0.93 R means the outcome equaled 0.93 times that distance.
Recent examples show the pattern:
- On 28 October 2026, a 15m long-side scenario became active at a reference price of 1.1123 and resolved with a partial outcome of 0.93 R.
- On 23 October 2026, a 15m long-side scenario became active at a reference price of 1.11975 and resolved on 26 October 2026 with a partial outcome of 1.52 R.
- On 21 October 2026, a 1H short-side scenario became active at a reference price of 1.12298 and resolved with a partial outcome of 0.13 R.
- On 19 October 2026, a 30m long-side scenario became active at a reference price of 1.12157 and resolved with a partial outcome of 0.03 R.
- On 8 October 2026, a 1H long-side scenario became active at a reference price of 1.12 and resolved with a partial outcome of 0.19 R.
The broader 30-day backdrop is selective. In that same window, 44 setups were invalidated before becoming active, 24 expired without becoming active, and 0 are in progress.
How Znorva AI reads this market
Znorva AI uses a liquidity sweep and reclaim method. The engine looks for a reference level, such as a previous day, week, or month high or low, to be swept first. It then requires 2 completed closes back beyond that level for a reclaim. After that, it tracks up to 3 targets and reviews outcomes across 7-day and 30-day windows.
In the current EUR/USD picture, the key message is failed confirmation rather than clean continuation. The market produced downside liquidity sweeps on 29 October 2026, but each reclaim window expired. That means the engine did not get the follow-through needed to keep those analytical scenarios valid.
This also explains why the latest 24-hour summary shows 8 invalidations and no newly active setups. Price moved, but the model did not see enough confirmation at the relevant reference levels.
If you want the broader workflow behind this type of market read, Znorva also shows its AI chart analysis process. For traders comparing majors side by side, there is also a combined recap for EUR/USD, GBP/USD, and XAU/USD.
FAQ
What does EUR/USD analysis today say about direction?
The latest daily close was 1.11822 after a 0.25% gain on 29 October 2026. Even so, the 8 invalidations in the last 24 hours show that the model still saw limited confirmation.
What does invalidated before becoming active mean?
It means an analytical scenario failed its activation condition before it could become active at a reference price. In the latest update, that happened 8 times.
Are there any demand or supply zones right now?
No. The current engine snapshot shows no active demand zone or supply zone for EUR/USD.