ATR stop loss placement for chart structure and model rules
Data as of 2026-10-30 23:59 UTC · Levels and zones: Znorva analysis engine
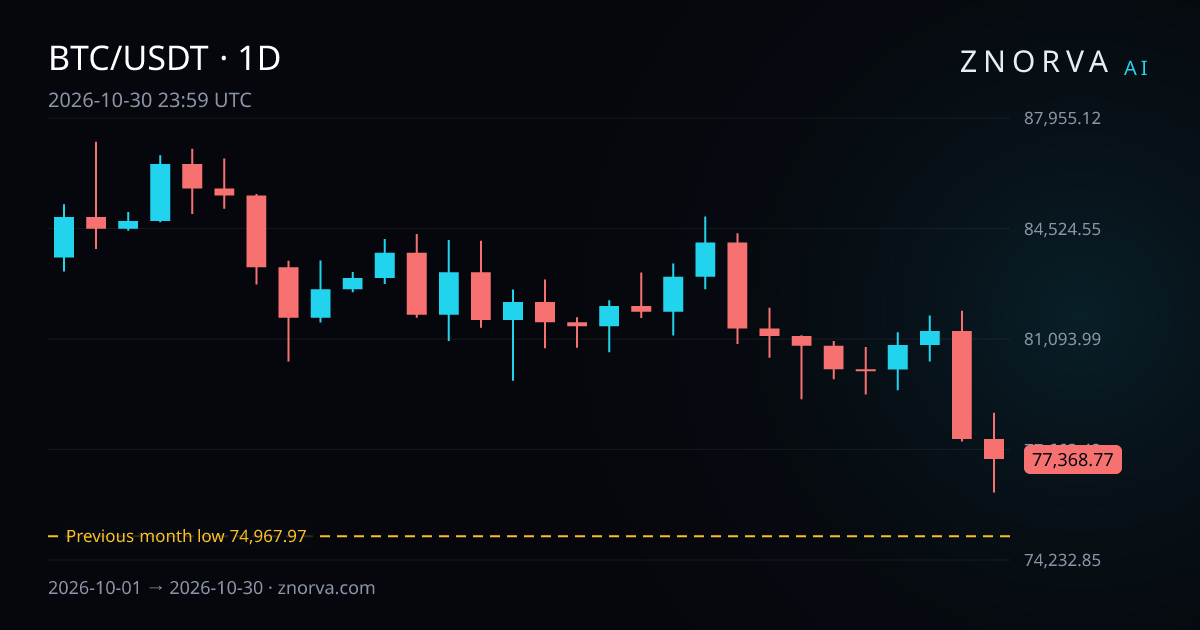
ATR stop loss placement works better when chart structure sets the idea and volatility only refines the stop level. This guide uses Znorva data dated 2026-10-30 23:59 UTC. The dataset confirms reclaim rules, target tracking, and entry-zone priority. It does not publish an ATR multiplier, so the useful lesson here is where ATR fits inside a structure-first method.
What it is
ATR measures recent range. In ATR stop loss placement, traders use that range so the stop level is not sitting inside normal market noise. That helps reduce stops that are too tight for the current environment.
ATR does not answer the full question by itself. It can tell you how much a market has been moving, but it does not tell you where a long-side or short-side scenario becomes wrong. That part comes from structure.
In this method, structure starts with a reference level. Then the market sweeps that level and reclaims it. A reclaim means 2 completed closes back beyond the level. After that, ATR can act as a second check on space, while structure defines invalidation.
How to spot it on a chart
Start with the nearest reference levels. These are previous day, week, or month highs and lows. They matter because they are clear points where liquidity often builds.
Next, look for a liquidity sweep. That is the move through a reference level. A sweep alone is not enough in this method. The market also needs a reclaim, which means 2 completed closes back beyond the level.
After the reclaim, map the possible entry area. The model gives priority to BPR first, then IFVG, then FVG. That sequence matters because it keeps the selection rule-based instead of random.
For broader context, use a multi-timeframe chart reading. A setup on 15m can look very different when you also check the nearby 1H or 4H structure.
Useful chart labels in this process are:
- reference level: a previous day, week, or month high or low
- demand zone: an area where buyers showed clear interest
- supply zone: an area where sellers showed clear interest
- nearest reference levels: the closest calendar highs and lows around the market
The practical point is simple. ATR should support the placement, not replace the structure. If there is no sweep and no reclaim, the chart has not done enough work yet.
How Znorva AI uses it (the method)
Znorva's rule set is built around reclaimed reference levels and clear outcome tracking. You can see the full logic in the methodology. In the data used here, the method confirms 3 targets and a fixed entry priority of BPR, then IFVG, then FVG.
R is the distance between the reference entry and the model's stop level. That gives a standard way to compare outcomes across different markets and timeframes. A move of -1 R means the setup resolved at the model's stop level. A move of +2 R means the market traveled twice that distance in the setup's favor.
For the wider chart process, see AI chart analysis. That workflow shows how context, reference levels, and setup rules fit together before a model setup becomes active.
A real example from our data
The clearest example in the dataset is BTCUSDT in crypto futures. It was a long-side scenario on the 15m timeframe. It became active at a reference price of 78,002.8 on 30 October 2026 and resolved under the model's rules at 76,336.92 on 30 October 2026. The outcome was -1 R, which means it resolved at the model's stop level.
That result matters because it keeps the lesson honest. A setup can follow the rules and still fail. ATR can help keep the stop level out of ordinary range, but it cannot rescue a scenario once the structure no longer holds.
The recent results in the same dataset show the same balance. Over 60 days, the model recorded 28 resolved setups. In that group, 1 reached its final target, 12 were partial outcomes, and 15 resolved at the model's stop level. Over 30 days, 304 setups were invalidated before becoming active.
The nearby reference-level example also helps. On the 1D timeframe, Bitcoin's previous month low from 1 September 2026 to 30 September 2026 was 74,967.97. That level sat below the market. It was 3.1% away from the daily close of 77,368.77 on 30 October 2026.
This is why reference levels matter in stop placement. They show where the market has already reacted on a higher timeframe. Even when you use ATR, a stop level makes more sense when it respects those nearby structural points.
Common mistakes
The first mistake is using ATR with no structural anchor. A volatility reading can tell you that a market is moving, but it does not tell you which level invalidates the scenario. In this method, the reclaim does that work.
The second mistake is treating one push through a level as enough. The rule is stricter. It wants 2 completed closes back beyond the level. Without that reclaim, the setup can be invalidated before becoming active.
The third mistake is ignoring context around the entry area. Entry priority matters, and so do the nearest reference levels. A related guide on support and resistance entry and stop ideas shows why structure should lead the placement, with volatility used as support rather than the main rule.
FAQ
Can ATR stop loss placement work without a reclaim?
It can be used that way, but not in this method. Here, the reclaim is the structural filter. The market needs 2 completed closes back beyond the reference level before the scenario is treated as valid in the same way.
What does -1 R mean in the BTCUSDT example?
It means the setup resolved at the model's stop level. R is the distance between the reference entry and the model's stop level, so -1 R is one full unit of model-defined risk.
Which reference level was nearest in the data?
The dataset shows Bitcoin's previous month low on the 1D timeframe at 74,967.97. It was below the market and sat 3.1% away from the daily close of 77,368.77 on 30 October 2026.