Gold Price Analysis Today: 2 setups invalidated, 4067.54 daily close, 29 October 2026
Data as of 2026-10-28 20:59 UTC · Levels and zones: Znorva analysis engine
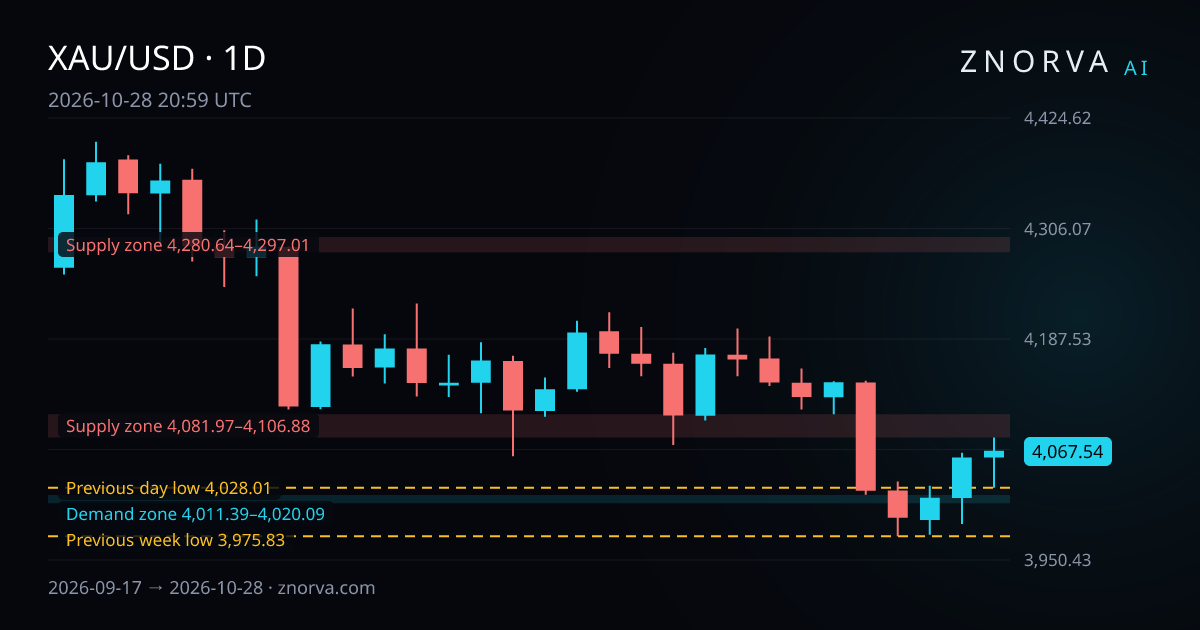
gold price analysis today shows XAU/USD closed at 4067.54 on 28 October 2026, while 2 model setups were invalidated before becoming active. The daily move was 0.18%, and this snapshot uses the data timestamp 2026-10-28 20:59 UTC.
Gold price snapshot
Gold ended 28 October 2026 with a narrow net gain after a wider intraday swing.
- Open: 4060.4
- High: 4081.97
- Low: 4028.01
- Close: 4067.54
- Daily change: 0.18%
- Daily range: 1.34%
Over the last 7 sessions, from 20 October 2026 to 28 October 2026, Gold moved from an open of 4140.6 to a close of 4067.54. In that span, the high was 4155.9, the low was 3975.83, and the total change was -1.76%.
Across the last 30 sessions, from 17 September 2026 to 28 October 2026, Gold printed a high of 4399.22 and a low of 3975.83. If you want the dedicated market page, see the XAU/USD page.
Nearest reference levels and zones
From the daily close of 4067.54, all distances below are measured from that close. Zone distances are measured to the nearest edge of each zone.
Nearest reference levels:
- Previous week low on 4H: 3975.83
- Previous day low on 1H: 4028.01
The previous week low is 2.25% below. The previous day low is 0.97% below.
Nearest zones:
- Demand zone on 4H: 4011.39 to 4020.09, formed on 27 October 2026, classified Strong by the engine
- Demand zone on 1D: 3799 to 3806.92, formed on 30 September 2025, classified Strong by the engine
- Supply zone on 1D: 4081.97 to 4106.88, formed on 23 October 2026, classified Strong by the engine
- Supply zone on 4H: 4280.64 to 4297.01, formed on 28 September 2026, classified Strong by the engine
The nearest zone is the 1D supply zone, 0.35% away. The 4H demand zone is 1.17% away. The 4H supply zone is 5.24% away. The 1D demand zone is 6.41% away.
That placement matters. Gold closed just under a nearby supply area, while the closest downside references sit below the market rather than inside it.
What changed since yesterday?
The daily close rose 0.18% versus 27 October 2026, and the session range was 1.34%. During that move, the market touched the previous day low reference level at 4028.01.
No new zones were added in the last 48 hours. No model-tracked outcomes resolved under the model's rules in the last 24 hours, and no setup became active in that same 24-hour window.
The main change was invalidation activity. Two setups were invalidated before becoming active. That fits a session where price still interacted with a nearby reference level, but the follow-through did not confirm a new analytical scenario.
The engine also marked liquidity sweeps tied to previous day highs at 4029.98 and 4065.54 on 28 October 2026. One later expired without becoming active. The other had already been used by the model.
Model-tracked outcomes
Model-tracked outcomes are hypothetical analytical results, not executed trades or customer results. Znorva does not execute trades.
Across the last 30 days, 9 setups resolved under the model's rules. The net hypothetical model-tracked outcome was -2.53 R. R is the distance between the reference entry and the model's stop level.
Inside those 9 resolved setups:
- 1 reached its final target
- 3 produced a partial outcome
- 0 resolved at breakeven
- 5 resolved at the model's stop level
- 0 are still tracked by the model
Outside that resolved group, the separate 14-day invalidation window logged 25 invalidations. Across the same 30-day view, 25 setups expired without becoming active.
Recent examples show how mixed the model history has been:
- A 1H long-side scenario became active at a reference price of 4124.71 on 21 October 2026 and resolved at the model's stop level at 4104.04 on 22 October 2026, for -1 R.
- A 30m long-side scenario became active at a reference price of 4120.14 on 21 October 2026 and reached target 1, then resolved, for 0.5 R.
- A 1H long-side scenario became active at a reference price of 4175.89 on 13 October 2026 and resolved at the model's stop level at 4148.1 on 13 October 2026, for -1 R.
- A 15m long-side scenario became active at a reference price of 4114.55 on 7 October 2026 and reached its final target at 4183.93 on 9 October 2026, for 1.21 R.
- A 1H short-side scenario became active at a reference price of 4160.81 on 6 October 2026 and resolved at the model's stop level at 4183.83 on 6 October 2026, for -1 R.
The short version is simple. Recent model-tracked outcomes have not been one-sided, and the latest session added invalidations rather than fresh active setups.
How Znorva AI reads this market
Znorva AI starts with a liquidity sweep and reclaim framework. A liquidity sweep tests a previous day, week, or month high or low. A reclaim needs 2 completed closes back beyond that reference level before a setup can become active.
The method then tracks 3 targets. If the reclaim does not confirm, the setup can be invalidated before becoming active or can expire without becoming active. That distinction matters here because the last 24 hours logged 2 invalidations, 0 newly active setups, and 0 setups still tracked by the model.
You can compare that framework with the broader AI forex analysis overview and the latest EUR/USD, GBP/USD, and XAU/USD market posts. In this Gold update, the model is balancing a nearby 1D supply zone above the close against downside reference lows and a 4H demand zone below.
FAQ
What does gold price analysis today show?
It shows a daily close at 4067.54, a daily gain of 0.18%, and 2 setups invalidated before becoming active. It also shows the nearest zone is a 1D supply zone only 0.35% away.
Why does the daily close matter in this reading?
The daily close is the base for every distance in this update. That is why the nearest reference levels and zones are described from 4067.54.
Are any setups still active in Gold now?
No. The current count of setups still tracked by the model is 0.