Bitcoin Price Analysis Today: 2 setups invalidated, close 80,150.56, 27 October 2026
Data as of 2026-10-26 23:59 UTC · Levels and zones: Znorva analysis engine
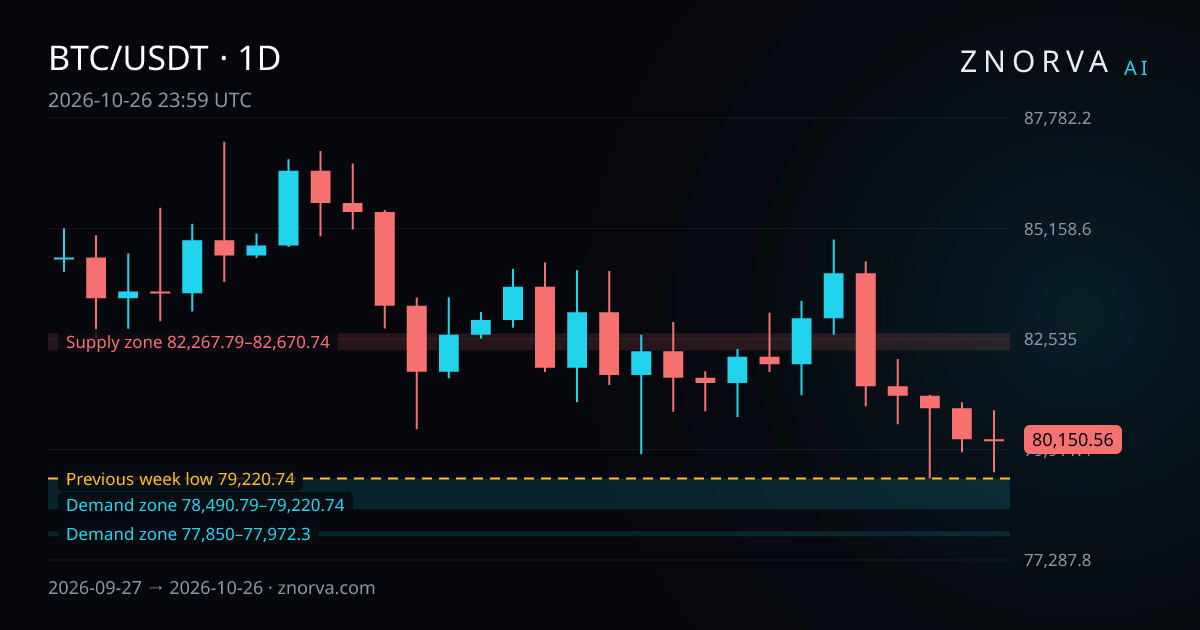
bitcoin price analysis today starts with 2 model setups invalidated before becoming active, while Bitcoin’s latest daily close stands at 80,150.56. That close belongs to 26 October 2026, and the market data timestamp is 2026-10-26 23:59 UTC.
Bitcoin price snapshot
Bitcoin closed at 80,150.56 on 26 October 2026. The session opened at 80,154.09, printed a high of 80,844.7, and reached a low of 79,368.67. The DATA records the close-to-close move as 0%, while the full daily range came in at 1.86%.
The prior session, on 25 October 2026, closed at 80,154.09. That puts the latest close very near the previous one, even though the session still covered a meaningful intraday range.
Across the last 7 sessions, from 20 October 2026 to 26 October 2026, BTC/USDT moved from an open of 81,938.39 to a close of 80,150.56. The high in that stretch was 84,898, the low was 79,220.74, and the net move for the period was -2.18%.
Across the last 30 sessions, Bitcoin traded between 79,220.74 and 87,220. That keeps the latest daily close in the lower part of the recent 30-session range rather than near the top. For a broader market view, see Znorva’s Bitcoin coverage and wider crypto market coverage.
Nearest reference levels and zones
All distance figures below are measured from the daily close of 80,150.56.
The nearest reference levels are both below the market. The previous week low on the 4H timeframe sits at 79,220.74, which is 1.16% away. The previous month low on the 1D timeframe sits at 74,967.97, which is 6.47% away.
The zone map is also clear. A 4H demand zone runs from 78,490.79 to 79,220.74, and it is 1.16% away. It is classified Strong by the engine. A second 4H demand zone runs from 77,850 to 77,972.3, and it is 2.72% away. It is classified Strong by the engine.
Above the market, the first 4H supply zone runs from 82,267.79 to 82,670.74, which is 2.64% away. It is classified Strong by the engine. Farther up, a 1D supply zone runs from 88,833.65 to 90,600, which is 10.83% away. It is classified Strong by the engine.
One useful detail is the overlap between the previous week low at 79,220.74 and the upper edge of the nearest 4H demand zone. In plain terms, the closest reference level and the closest demand zone meet at the same price.
No liquidity sweep is listed in the current market facts. That leaves the map straightforward: the nearest reference levels and demand zones are below the market, while the first supply zone remains overhead.
What changed since yesterday?
The main update is not directional. The DATA records a 0% close change over the last 24 hours, but Bitcoin still posted a 1.86% session range. That means movement happened inside the session without changing the daily close in percentage terms.
No reference level was touched in the latest 24-hour window. No new zones were added in the last 48 hours. No setups resolved under the model’s rules in the last 24 hours, and no new setups became active.
What did change was invalidation. In the last 24 hours, 2 setups were invalidated before becoming active. That tells you the engine had analytical scenarios on the board, but market structure did not keep the conditions needed for activation.
Model-tracked outcomes
Model-tracked outcomes are hypothetical analytical results, not executed trades or customer results. Znorva does not execute trades.
R = the distance between the reference entry and the model’s stop level (1 R). A result of +2 R means twice that distance.
Over the model’s 30-day tracking window, 15 setups resolved under the model’s rules. One reached its final target. Five ended as a partial outcome (TP1 reached, then resolved). None resolved at breakeven. Nine resolved at the model’s stop level. The net hypothetical model-tracked outcome across those resolved setups was -4.95 R.
The same summary shows 2 setups still tracked by the model. It also shows 34 that expired without becoming active. The invalidated count uses a 14-day window, and that figure stands at 39.
Recent examples help show the mix:
- A 4H long-side scenario in crypto futures became active at a reference price of 81,906.1 on 15 October 2026. It resolved under the model’s rules on 24 October 2026 as a partial outcome (TP1 reached, then resolved). Outcome: 0.06 R.
- A 4H long-side scenario in crypto spot became active at a reference price of 81,943.84 on 16 October 2026. It resolved under the model’s rules on 24 October 2026 as a partial outcome (TP1 reached, then resolved). Outcome: 0.07 R.
- A 15m long-side scenario in crypto futures became active at a reference price of 80,698 on 24 October 2026. It resolved under the model’s rules on 24 October 2026 at the model’s stop level. Outcome: -1 R.
- A 15m short-side scenario in crypto futures became active at a reference price of 82,611.7 on 20 October 2026. It resolved under the model’s rules on 21 October 2026 at the model’s stop level. Outcome: -1 R.
- A 1H long-side scenario in crypto spot became active at a reference price of 81,755.01 on 16 October 2026. It resolved under the model’s rules on 19 October 2026 as a partial outcome (TP1 reached, then resolved). Outcome: 0.26 R.
How Znorva AI reads this market
Znorva AI starts with reference levels. From there, it checks for a liquidity sweep and then a reclaim, which means 2 completed closes back beyond the level. If that sequence is present, the engine can map a model setup with up to 3 targets across its tracked timeframes and review windows of 7 days and 30 days.
If that sequence is missing, a setup may never become active. It can remain inactive, become invalidated, or expire without activation. That framework fits the current BTC/USDT reading well, because no liquidity sweep is listed, no reference level was touched in the latest change window, and no new setup became active in the last 24 hours.
That is why today’s headline matters. The key development is not a breakout or a reclaim. It is the loss of 2 setup conditions before activation, while price still closed at 80,150.56. If you want the full step-by-step framework, read how to analyze BTC with AI.
FAQ
What does bitcoin price analysis today show for BTC/USDT?
It shows a daily close of 80,150.56 on 26 October 2026, a 0% close-to-close move, and a 1.86% daily range. It also shows that 2 model setups were invalidated before becoming active.
Where are the nearest reference levels and zones?
The nearest reference level is the previous week low at 79,220.74, 1.16% away from the daily close. The nearest zone is a 4H demand zone from 78,490.79 to 79,220.74, also 1.16% away.
Why do invalidated setups matter here?
They show that the engine had valid conditions forming, but those conditions did not hold long enough for activation. In this reading, invalidation stands out more than momentum because no reference level was touched and no new setup became active in the latest 24-hour window.