Supply And Demand Zones Explained: a plain guide to chart zones
Data as of 2026-10-16 23:59 UTC · Levels and zones: Znorva analysis engine
Supply and demand zones explained starts with a simple idea: a zone is an area, not a single line. This guide shows what these zones are, how traders mark them, and how Znorva tracks them inside a fixed method. Data timestamp: 2026-10-16 23:59 UTC.
What it is
A demand zone is an area where price moved away to the upside before. A supply zone is an area where price moved away to the downside before. Traders use zones because price often reacts inside a range, not at one exact number.
Zones matter most when they sit near a reference level. In the Znorva method, a reference level is a previous day, week, or month high or low. The zone shows where the move began. The reference level shows why the area matters in the wider chart structure.
That is why many traders draw the zone as a block. Price can react at the first edge, move deeper into the area, or move through it and reclaim it later. A single line often hides that detail.
If you want to see how Znorva groups these areas on charts, start with the Whale Zones overview.
How to spot it on a chart
Start with the move away. A useful zone usually has a short base and then a clear push out of that base. Mark the area left behind before that move.
For a demand zone, mark the area left behind before price pushed higher. For a supply zone, mark the area left behind before price pushed lower. Then compare that zone with the nearest reference levels. A zone near a previous day, week, or month high or low usually has better context than one sitting in the middle of a broad range.
It also helps to work from higher timeframe structure down to lower timeframe detail. A 1D or 4H chart can show the wider reference level. A 1H or 15m chart can show the smaller zone that defines the setup.
Keep the drawing simple. Do not turn every candle body and wick into its own zone. Focus on the base that led to a clean move away. If the move out of the area is messy, the zone is harder to read.
How Znorva AI uses it (the method)
Znorva does not use a zone on its own. First, the model looks for a liquidity sweep of a reference level. After that, it waits for a reclaim. In this method, reclaim means 2 completed closes back beyond the level.
Only after the sweep and reclaim does the model look for the zone that can define the setup. When more than one zone qualifies, the priority order is BPR, then IFVG, then FVG. The model tracks 3 targets.
Results are recorded in R. R = the distance between the reference entry and the model's stop level (1 R). So +1.76 R means the move is measured against that original risk unit, not against a raw point move.
This filter is designed to keep the reading consistent. The model wants the reference level, the liquidity sweep, the reclaim, and the qualifying zone to line up before a setup becomes active. You can read the full methodology, see a broader crypto example in the Whale Zones guide, and review the institutional zone detector walkthrough.
A real example from our data
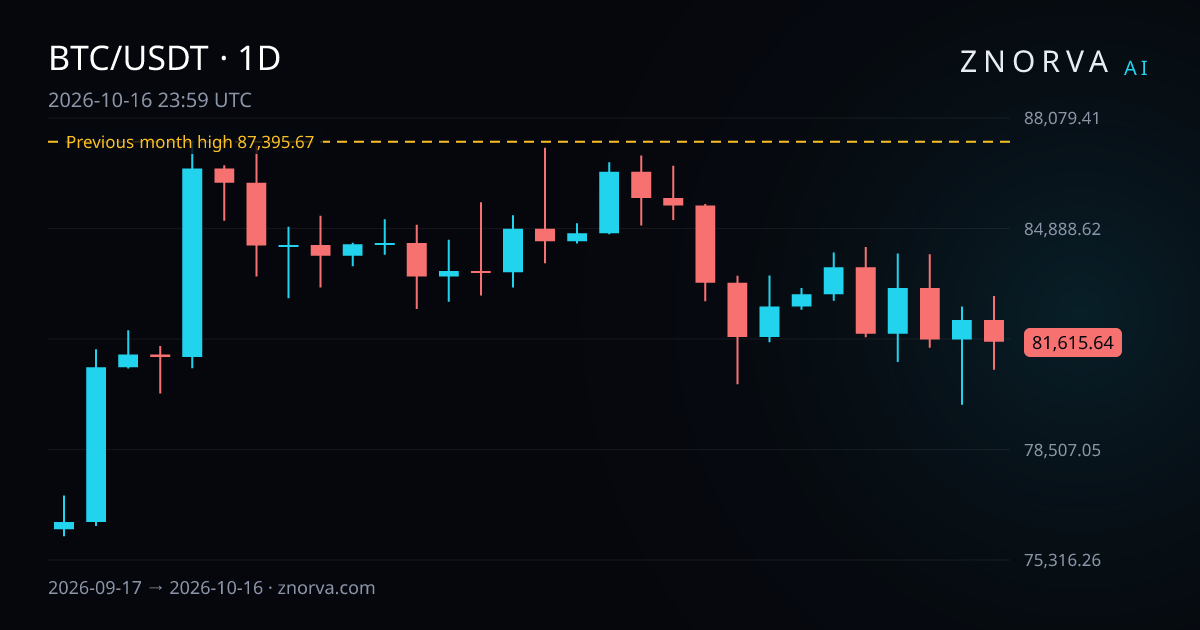
Bitcoin gives a clear reference-level example. On the 1D timeframe, the previous month high from 1 September 2026 to 30 September 2026 was 87,395.67 on BTCUSDT. That reference level was above the market. From the daily close of 81,615.64, it was 7.08% away.
Now look at one model setup in the same market. It was a short-side scenario on BTCUSDT in crypto futures on the 15m timeframe. It became active at a reference price of 82,359.6 on 16 October 2026 and resolved under the model's rules at 81,552.39 on 16 October 2026.
The recorded outcome was a partial outcome. Target 1 (TP1) was reached, then the remaining portion resolved under the model's rules. The result was 1.76 R.
This example also shows how the labels stay precise. A setup that reached target 1 is not the same as one that reached its final target. A partial outcome is not the same as a setup that resolved at the model's stop level. Those labels help keep records consistent.
The recent sample shows how selective the filters are. Over the last 60 days, 23 setups resolved under the model's rules. Of those, 4 reached a target, 6 were partial outcomes, and 13 resolved at the model's stop level. In a separate 30-day window, 618 model setups were invalidated before becoming active.
Common mistakes
One mistake is drawing zones from every pause in price. Most pauses do not matter. A useful zone usually has a clear base and a clear move away.
Another mistake is ignoring the reference level. A supply zone or demand zone becomes more useful when it is read beside the nearest reference levels. Without that context, the area can look important while still lacking a clear structural reason.
A third mistake is treating the liquidity sweep as enough on its own. In the Znorva method, the reclaim matters. If price does not print 2 completed closes back beyond the level, the level has not been reclaimed.
A fourth mistake is reading every result as all-or-nothing. Znorva keeps separate labels for target reached, partial outcome, resolved at the model's stop level, invalidated before becoming active, expired without becoming active, and in progress.
FAQ
What is the difference between a zone and a reference level?
A zone is an area where price moved away sharply before. A reference level is a previous day, week, or month high or low. Znorva reads the zone beside the nearest reference levels, not in isolation.
Why does Znorva wait for a reclaim?
A sweep only shows that liquidity was taken around the reference level. The reclaim shows price moved back beyond that level. In this method, the reclaim needs 2 completed closes.
Can a 15m setup use a higher-timeframe reference level?
Yes. In the example above, the setup used the 15m timeframe, while the reference level came from the previous month high on the 1D timeframe. That top-down mix lets the model connect local structure with wider context.