Liquidity sweep vs breakout: a simple guide
Data as of 2026-10-23 23:59 UTC · Levels and zones: Znorva analysis engine
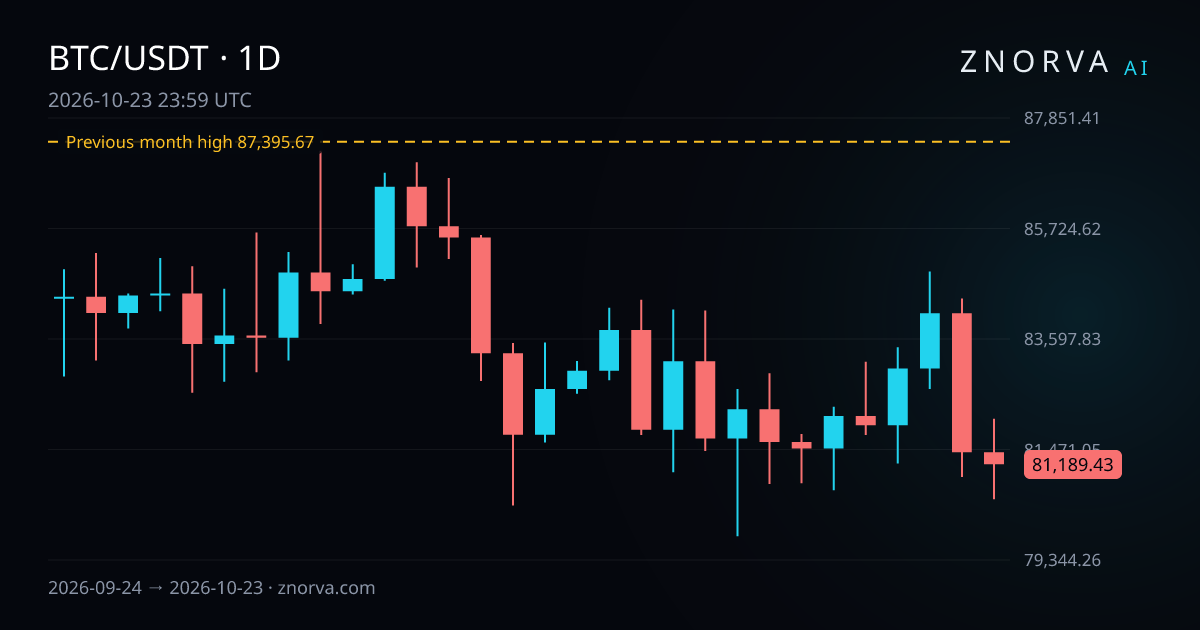
Liquidity sweep vs breakout is a common chart-reading problem. A move through a reference level can look like continuation, then fail and reclaim that level. This guide explains the difference, the reclaim rule Znorva uses, and what the model's recent outcomes looked like. It uses the data snapshot from 2026-10-23 23:59 UTC. For the full rule set, see the method rules.
What it is
A breakout moves beyond a reference level and keeps closing beyond it. A liquidity sweep moves through that same kind of level, takes liquidity resting there, and then returns back across it.
In Znorva's method, the key test is the reclaim. A reclaim means 2 completed closes back beyond the level. That rule helps separate a brief sweep from a move that is still holding outside the level.
The reference level also matters. Znorva starts with previous day, week, or month highs and lows. Those are fixed reference levels, not random intraday lines. That makes the method easier to repeat across markets and timeframes.
If you want the wider chart framework behind these ideas, see this technical guide for retail traders.
How to spot it on a chart
Start with the nearest reference levels. Mark the previous day, week, or month high and low. Then watch what happens when price reaches one of them.
A simple checklist helps:
- Mark whether price is moving above a prior high or below a prior low.
- Watch the closes after the first move through the level.
- If price keeps closing beyond the level, that supports a breakout idea.
- If price returns and prints a reclaim with 2 completed closes back beyond the level, that supports a liquidity sweep idea.
- Only after that should you look for a demand zone or supply zone that fits the method.
The Bitcoin example in the data shows how a clean reference level looks. On the 1D timeframe, Bitcoin had a previous month high at 87,395.67. That previous month ran from 1 September 2026 to 30 September 2026. From the daily close of 81,189.43 on 23 October 2026, that level was 7.64% above.
That reading does not predict the next move by itself. It simply marks a clear place where the chart can show either continuation beyond the level or a sweep followed by reclaim. You can see how Znorva maps that structure on its Bitcoin page.
How Znorva AI uses it (the method)
Znorva turns the chart idea into a rule-based setup. The engine begins with a reference level. It then waits for the reclaim with 2 completed closes back beyond that level.
After the reclaim, the method looks for a zone that fits its rules. The zone priority is fixed: BPR first, then IFVG, then FVG. That order matters because it keeps the process consistent.
The model uses 3 targets for each valid setup. A scenario only became active at a reference price when the conditions were met. Until then, it could be filtered out and never become active.
R is the distance between the reference entry and the model's stop level. That gives a common way to describe outcomes across different markets. For example, -1 R means the scenario resolved at the model's stop level.
This structure matters because the method does not react to the first move alone. It waits for the reclaim, then checks whether the zone appears in the required order. If you want to see how that process is organized inside the product flow, visit the chart workflow.
A real example from our data
The clearest setup example in the data is XAUUSD in forex on the 1H timeframe. It was a long-side scenario.
It became active at a reference price of 4,124.71 on 21 October 2026. It resolved at the model's stop level at 4,104.04 on 22 October 2026. The hypothetical model-tracked outcome was -1 R.
That single case is useful because it shows the method without adding certainty that is not there. A clean reclaim-based structure can still fail after activation. The point of the method is to define the conditions in advance and then record the outcome under the same rules.
The wider record adds context. Over the last 60 days, 24 setups resolved under the model's rules. Of those 24, 3 reached their final target, 10 were partial outcomes, and 11 resolved at the model's stop level.
There is also a large filter before activation. Over the last 30 days, 420 scenarios were invalidated before becoming active. That matters because most chart ideas never complete the full sequence. The reclaim may fail, or the required zone may never appear in the preferred order.
So the method says no far more often than yes. That filter is a major part of how Znorva separates a sweep from a breakout in a structured way.
Common mistakes
The first mistake is calling every push through a level a breakout. The first move is only the start. What matters next is whether price keeps closing beyond the level or reclaims it.
The second mistake is using random intraday highs and lows as the main reference. Previous day, week, and month highs or lows are more consistent for this method.
The third mistake is ignoring how distance is measured. In the Bitcoin example, the 7.64% reading is measured from the daily close of 81,189.43 on 23 October 2026. That keeps the comparison stable.
The fourth mistake is forcing a zone before the reclaim appears. In this method, the reclaim comes first. Then the model checks the zone in the required priority: BPR, IFVG, then FVG.
The fifth mistake is only remembering target reached examples. The XAUUSD case and the 11 setups that resolved at the model's stop level in the 60-day record matter just as much. They show how the rules behave when a clean idea still fails.
FAQ
What confirms a liquidity sweep instead of a breakout?
In this method, the key confirmation is the reclaim: 2 completed closes back beyond the reference level. After that, the model still needs a valid zone before a setup can become active.
Why does Znorva invalidate so many scenarios?
Because many moves never complete the full structure. In the last 30 days, 420 scenarios were invalidated before becoming active. That means the reclaim failed, or the required zone never formed in the preferred order.
Can liquidity sweep vs breakout work in both crypto and forex?
Yes. The data shows a Bitcoin reference level on the 1D timeframe and an XAUUSD long-side scenario on the 1H timeframe. The market changes, but the method stays the same: start with the nearest reference levels, wait for the reclaim, and then check whether the zone fits the rule set.