How to Read Gold Support and Resistance Levels: Simple Chart Guide
Data as of 2026-10-23 20:59 UTC · Levels and zones: Znorva analysis engine
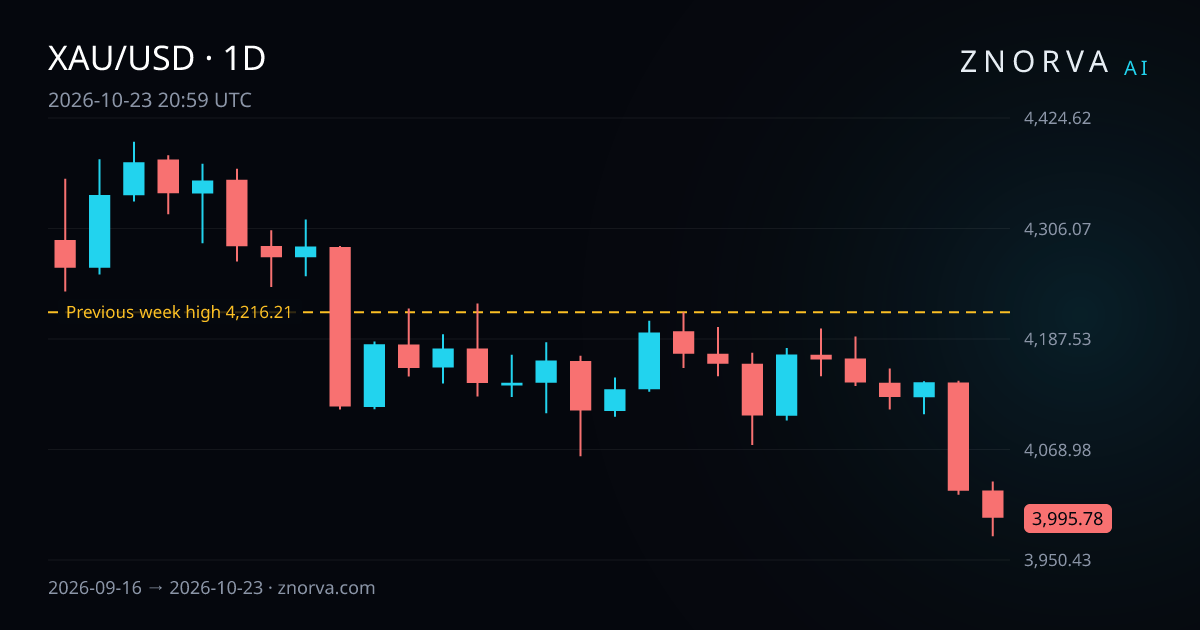
How to read gold support and resistance levels starts with a simple job: mark the nearest reference levels, then watch the reaction when price returns there. This guide uses Znorva data with the timestamp 2026-10-23 20:59 UTC and follows the same framework shown on our gold market page.
What it is
Support and resistance are areas where price has reacted before. In gold, those areas often come from public reference levels such as a previous day, previous week, or previous month high or low. They can also come from a demand zone or a supply zone.
The key idea is simple. The level is only the map. The reaction tells you what that map means. A level can act as resistance while price stays below it, then act differently if price sweeps it and comes back through it.
A reclaim matters here. In the Znorva method, a reclaim means price moved beyond a reference level and then printed 2 completed closes back beyond that level. That helps separate a true shift from a brief push through liquidity.
Common chart objects include:
- a reference level from a previous day, previous week, or previous month high or low
- a demand zone below price
- a supply zone above price
- a liquidity sweep through a known reference level
If you also track currencies, the same language appears in our forex library.
How to spot it on a chart
Start with a clean chart. Mark the nearest reference levels first. Then add the clearest demand zone or supply zone. If you mark every small swing, the useful structure disappears.
Next, compare where gold is trading against those references. Ask direct questions. Is price approaching a previous week high from below? Is it reacting inside a demand zone? Did it push beyond a known level and then print 2 completed closes back through it?
Timeframe matters. If the level comes from 4H structure, read the reaction on 4H first. A lower timeframe move can be noisy, while the higher timeframe level is still doing the real work.
One more habit helps. Separate the level from the decision. The level is fixed. The reaction is what changes. That keeps the reading structured instead of emotional.
How Znorva AI uses it (the method)
Znorva turns this chart reading into a repeatable model. It starts with a reference level such as a previous high or low. Then it checks whether price swept that level and whether a reclaim formed with 2 completed closes.
If the reclaim is there, the model looks for a reference entry zone in this order:
- BPR
- IFVG
- FVG
The model tracks 3 targets for each active scenario. When results are reported in R, R is the distance between the reference entry and the model's stop level. That lets readers compare outcomes across different markets without mixing up raw price size.
The recent model record adds useful context. Over the last 60 days, 28 setups resolved under the model's rules. Of those, 3 reached their final target, 11 were partial outcomes, and 14 resolved at the model's stop level. Over the last 30 days, 394 scenarios were invalidated before becoming active.
The dataset also includes a BTCUSDT example from crypto futures on 4H. It was a long-side scenario that became active at a reference price of 81,906.1 on 15 October 2026 and resolved under the model's rules on 24 October 2026. The hypothetical model-tracked outcome was a partial outcome of 0.06 R.
A real example from our data
For gold, the current reference in the dataset comes from XAUUSD on 4H. The level is the previous week high from 11 October 2026 to 18 October 2026, set at 4,216.21.
From the daily close of 3,995.78 on 23 October 2026, that level is 5.52% above. That distance is measured from the daily close, which keeps every comparison consistent.
This matters because price is still below that previous week high. In plain chart reading, that makes the level easier to treat as resistance first, not support. If gold later sweeps that high and prints a reclaim, the reading can change. Until then, the level is a reference, not a prediction.
It also helps to think in layers. A previous week high on its own can matter. A previous week high that lines up with a supply zone can matter more because two separate chart ideas meet in one area.
If you want a second market example that includes XAUUSD with major FX pairs, see our XAUUSD and FX case study.
Common mistakes
The first mistake is drawing too many lines. A crowded chart makes every point look important. Start with the nearest reference levels and only add the clearest zone.
The second mistake is calling every move beyond a level a real break. Gold can run liquidity above a high or below a low, then reverse. Without a reclaim, the move may say less than it first appears to say.
The third mistake is ignoring the daily close when measuring distance. In this dataset, the gold reference is measured from the daily close of 3,995.78 on 23 October 2026. That keeps the distance reading consistent.
FAQ
How to read gold support and resistance levels without crowding the chart?
Start with previous day, previous week, and previous month highs and lows. Keep only the nearest reference levels and the clearest zone. Add a reclaim only after price has printed 2 completed closes back beyond the level.
Why does a previous week high matter in gold?
A previous week high is a public reference level, so many chart readers notice it. In this dataset, the previous week high in XAUUSD is 4,216.21 on 4H. From the daily close of 3,995.78 on 23 October 2026, it is 5.52% above.
What does a partial outcome mean in the Znorva method?
A partial outcome means target 1 was reached, then the setup resolved under the model's rules. It is different from reaching the final target and different from resolving at the model's stop level. The BTCUSDT 4H long-side scenario in the dataset finished with a hypothetical model-tracked outcome of 0.06 R.