Gold price analysis today: 2 model setups became active at 4141.17, 22 October 2026
Data as of 2026-10-21 20:59 UTC · Levels and zones: Znorva analysis engine
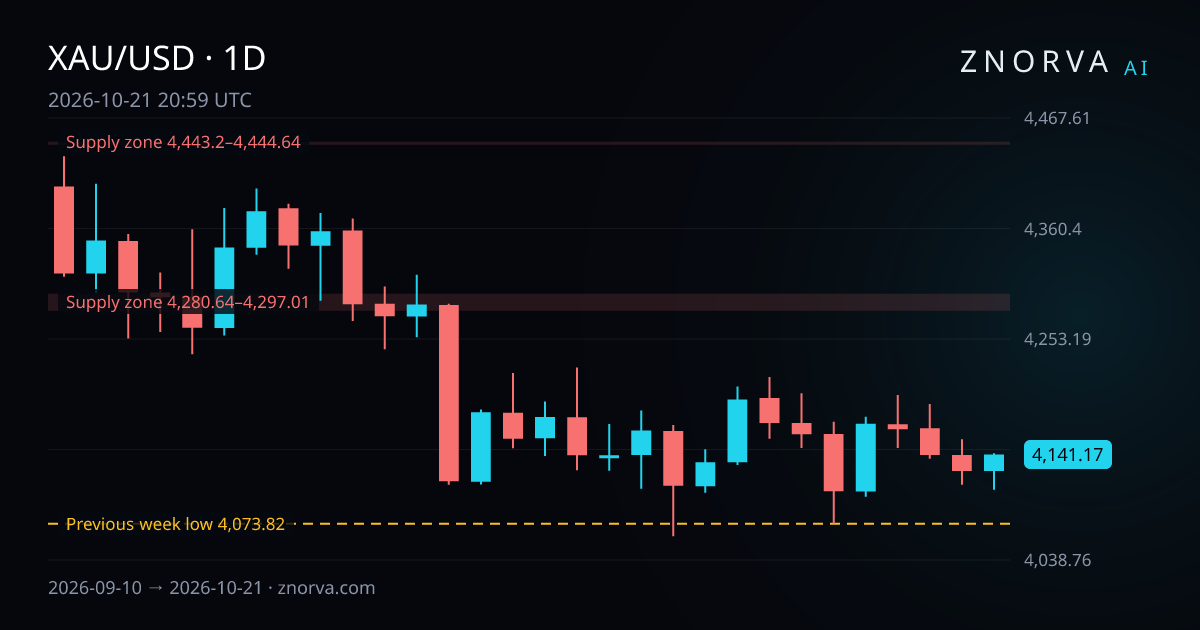
Gold price analysis today starts with one clear fact: 2 model setups became active at 4141.17. Gold closed at 4141.17 on 21 October 2026, and the latest daily-close snapshot is timestamped 2026-10-21 20:59 UTC. The broader model data also shows a 1H liquidity sweep of the previous day low at 4106.88, marked on 22 October 2026 and still awaiting reclaim.
Gold price snapshot
Gold ended 21 October 2026 at 4141.17. The session opened at 4125.04, printed a high of 4142.22, and reached a low of 4106.88 before the close. That left the day up 0.39%, with a session range of 0.86%.
The previous session, on 20 October 2026, closed at 4125.21. Over the last 7 sessions, from 13 October 2026 to 21 October 2026, XAU/USD moved from an open of 4171.69 to a close of 4141.17. That was a -0.73% move across the period.
Across the last 30 sessions, the market ranged from 4061.73 to 4430.46. The latest daily close is above that low and below that high. For broader context, Znorva also publishes AI gold analysis.
Nearest reference levels and zones
From the daily close of 4141.17, every percentage distance below is measured from that close to the nearest edge of the zone or to the reference level.
- The nearest reference level is the previous week low on the 4H timeframe at 4073.82. It sits 1.63% below.
- The nearest overhead zone is a 4H supply zone from 4280.64 to 4297.01. It is classified Strong by the engine and sits 3.37% away. It formed on 28 September 2026.
- A 1W supply zone runs from 4443.2 to 4444.64. It is classified Strong by the engine and sits 7.29% away. It formed on 13 September 2026.
- A 1D demand zone runs from 3799 to 3806.92. It is classified Strong by the engine and sits 8.07% away. It formed on 30 September 2025.
- Another 1D demand zone runs from 3674.27 to 3686.83. It is classified Strong by the engine and sits 10.97% away. It formed on 22 September 2025.
The closest listed downside reference is 4073.82. The closest listed overhead zone begins at 4280.64.
What changed since yesterday?
The latest daily close was 4141.17, up from 4125.21 on 20 October 2026. That daily move was 0.39%, and the range for 21 October 2026 was 0.86%.
In the last 24 hours, 2 model setups became active and 2 setups resolved under the model's rules. Another 2 setups were invalidated before becoming active. No new zones were added in the last 48 hours, and no nearest reference levels were marked as touched.
The main new level event is on the 1H timeframe. The previous day low at 4106.88 was swept on 22 October 2026 and is still awaiting reclaim. Two older low-side previous-day reference levels were also logged: 4137 expired on 21 October 2026, and 4111.84 was already used on 21 October 2026.
Model-tracked outcomes
Model-tracked outcomes are hypothetical analytical results, not executed trades or customer results. Znorva does not execute trades.
Over the last 30 days, 10 setups resolved under the model's rules. R is the distance between the reference entry and the model's stop level. Across those 10 outcomes, the combined hypothetical model-tracked outcome was -0.06 R.
The 30-day breakdown was:
- 2 reached their target.
- 3 delivered a partial outcome.
- 0 resolved at breakeven.
- 5 resolved at the model's stop level.
- 0 are in progress.
- 27 were invalidated before becoming active within the 14-day invalidation window.
- 20 expired without becoming active.
Recent examples show how that total formed:
- A 1H long-side scenario became active at a reference price of 4124.71 on 21 October 2026 and resolved at the model's stop level on 22 October 2026 for -1 R.
- A 30m long-side scenario became active at a reference price of 4120.14 on 21 October 2026, reached target 1 (TP1), then resolved under the model's rules on 21 October 2026 for 0.5 R.
- A 1H long-side scenario became active at a reference price of 4175.89 on 13 October 2026 and resolved at the model's stop level on 13 October 2026 for -1 R.
- A 15m long-side scenario became active at a reference price of 4114.55 on 7 October 2026 and reached its final target on 9 October 2026 for 1.21 R.
- A 1H short-side scenario became active at a reference price of 4160.81 on 6 October 2026 and resolved at the model's stop level on 6 October 2026 for -1 R.
How Znorva AI reads this market
Znorva AI starts with a liquidity sweep at a reference level. A reclaim needs 2 completed closes back beyond that level. If that condition appears, the model tracks up to 3 targets and records outcomes across 7-day and 30-day windows.
The same framework appears in Znorva's AI forex analysis and its EUR/USD, GBP/USD, and XAU/USD recap. For gold now, the latest structural point is the 1H sweep of 4106.88. Because the reclaim condition has not appeared yet, that event remains unresolved under the method.
FAQ
What does gold price analysis today show for the nearest reference levels?
The nearest listed reference level is the previous week low at 4073.82, which is 1.63% below the daily close. The nearest overhead zone starts at 4280.64 and is 3.37% away.
What does awaiting reclaim mean after the 4106.88 sweep?
It means the previous day low was swept on 22 October 2026, but the model has not seen the 2 completed closes needed for a reclaim. Until that happens, the event stays in an unfinished state under the method.
How has the model performed in gold over the last 30 days?
Over that window, 10 setups resolved under the model's rules for a combined outcome of -0.06 R. The breakdown was 2 target-reached outcomes, 3 partial outcomes, and 5 that resolved at the model's stop level.