Gold price analysis today: previous day high 4172.83 tested, close 4105.49, 15 October 2026
Data as of 2026-10-14 20:59 UTC · Levels and zones: Znorva analysis engine
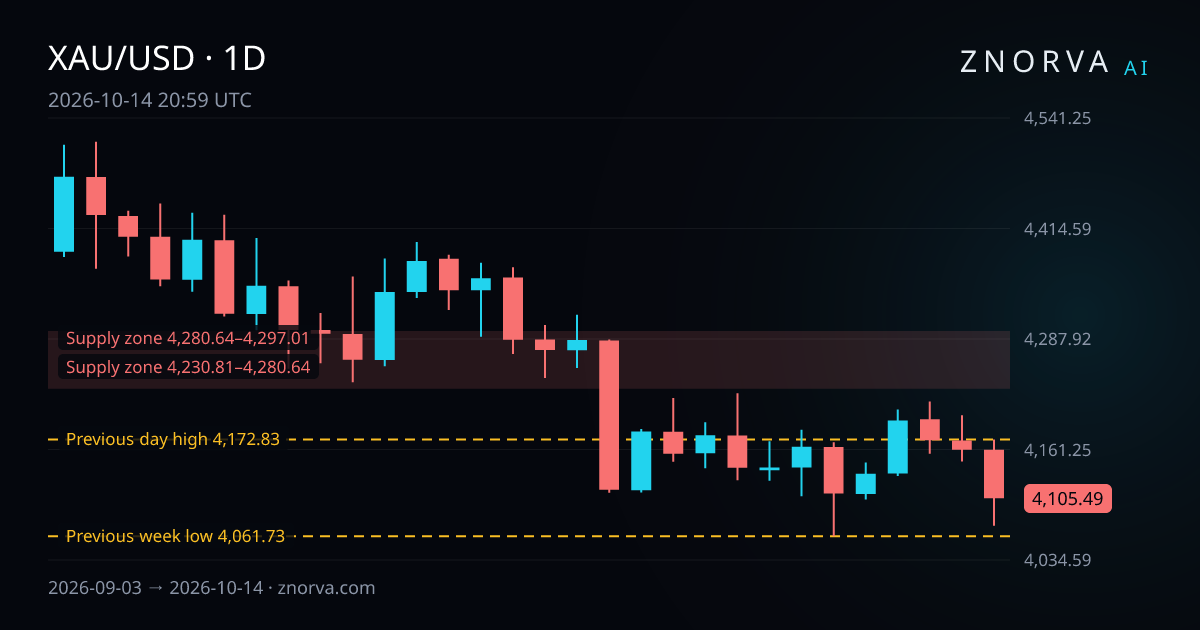
Gold price analysis today focuses on XAU/USD after the market tested the previous day high at 4172.83 and finished with a daily close at 4105.49. That was the clearest reference interaction in the latest session. The market data timestamp for this update is 2026-10-14 20:59 UTC. For the broader market page, see AI gold analysis.
Gold price snapshot
Gold had a weak session on 14 October 2026. The market opened at 4160.97, reached 4172.83, fell to 4073.82, and closed at 4105.49. That left the day at -1.33%, with a 2.43% range from high to low.
The latest 4H engine check showed 4144.83. That was above the daily close, but still below the session high of 4172.83.
Across the last 7 sessions, from 6 October 2026 to 14 October 2026, gold moved from an open of 4140.61 to a close of 4105.49. Over that span, the net change was -0.85%. The highest price in that window was 4216.21, and the lowest was 4061.73.
The 30-session range stayed wide. From 3 September 2026 to 14 October 2026, gold traded as high as 4514.11 and as low as 4061.73. For wider market context, Znorva also publishes AI forex analysis and a recurring EURUSD, GBPUSD and XAUUSD market recap.
Nearest reference levels and zones
All distances below are measured from the daily close of 4105.49. For zones, the distance is measured to the nearest edge.
The nearest reference level below is the previous week low at 4061.73 on the 4H timeframe. It is 1.07% below the daily close. The nearest reference level above is the previous day high at 4172.83 on the 1H timeframe. It is 1.64% above the daily close.
The nearest demand zone on the 1D timeframe runs from 3843.79 to 3889.99. It is classified Strong by the engine. It is 5.25% away. It formed on 8 October 2025.
A second 1D demand zone runs from 3799 to 3806.92. It is also classified Strong by the engine. It is 7.27% away. It formed on 30 September 2025.
On the upside, the nearest supply zone on the 4H timeframe runs from 4230.81 to 4280.64. It is classified Strong by the engine. It is 3.05% away. It formed on 28 September 2026.
A second 4H supply zone runs from 4280.64 to 4297.01. It is also classified Strong by the engine. It is 4.27% away. It formed on 28 September 2026.
Two previous day low references also saw a liquidity sweep on 14 October 2026. One was 4156.45 and later expired. The other was 4147.48 and had already been used earlier.
What changed since yesterday?
The move from 13 October 2026 to 14 October 2026 was clear on the close. On 13 October 2026, gold opened at 4171.69, reached 4200.45, fell to 4147.48, and closed at 4160.85. One session later, gold closed at 4105.49.
That means the daily close changed by -1.33%. The latest session also posted a 2.43% range. Within that move, one nearby reference level was tested: the previous day high at 4172.83.
There were 0 new zones in the last 48 hours. In the last 24 hours, 0 setups became active, 0 resolved under the model's rules, and 0 were invalidated.
Model-tracked outcomes
Model-tracked outcomes are hypothetical analytical results, not executed trades or customer results. Znorva does not execute trades.
Across the last 30 days, 8 setups resolved under the model's rules for a net outcome of 0.44 R. R is the distance between the reference entry and the model's stop level. In that same window, 2 setups reached their final target, 2 produced a partial outcome, 0 resolved at breakeven, and 4 resolved at the model's stop level.
There are 0 setups still tracked by the model. Over the same 30-day window, 33 setups were invalidated before becoming active, and 17 expired without becoming active.
Recent examples show how mixed the record has been. A 1H long-side scenario became active at a reference price of 4175.89 on 13 October 2026. It resolved under the model's rules on 13 October 2026 at the model's stop level for -1 R. A 15m long-side scenario became active at a reference price of 4114.55 on 7 October 2026. It resolved on 9 October 2026 and reached its final target for 1.21 R.
A 1H short-side scenario became active at a reference price of 4160.81 on 6 October 2026. It resolved on 6 October 2026 at the model's stop level for -1 R. A 15m long-side scenario became active at a reference price of 4134.11 on 5 October 2026 and produced a partial outcome after TP1 was reached, at 0.56 R. A 15m short-side scenario became active at a reference price of 4183.61 on 2 October 2026 and also produced a partial outcome after TP1 was reached, at 0.2 R.
How Znorva AI reads this market
In the methodology, Znorva AI starts with reference levels, then checks for a liquidity sweep and a reclaim. A reclaim means 2 completed closes back beyond the level. The model tracks 3 targets and uses both 7-day and 30-day context.
Applied here, the main fact is simple: gold tested the previous day high at 4172.83, then finished the session at 4105.49. The nearest reference level below is the previous week low at 4061.73. Overhead, the closest supply zone starts at 4230.81, while the nearest daily demand zone tops at 3889.99.
Because 0 setups are in progress and there was no new setup activity in the last 24 hours, this read is mainly structural. Gold sits between nearby reference levels, with supply closer above than daily demand below.
FAQ
Why does the previous day high at 4172.83 matter?
It was the main reference level tested in the latest session. Gold reached that level and still finished the day with a daily close at 4105.49.
What does gold price analysis today show for the nearest reference levels?
It shows gold between two nearby reference levels. The previous week low at 4061.73 is 1.07% below the daily close, and the previous day high at 4172.83 is 1.64% above it.
What does the 0.44 R result mean?
It is the net hypothetical model-tracked outcome from 8 resolved setups over the last 30 days. Since R is the distance between the reference entry and the model's stop level, 0.44 R means the net result over that period was modestly positive.