Gold Price Analysis Today: 1 model setup became active at 4110.86, XAU/USD -1.28% — 8 October 2026
Data as of 2026-10-07 20:59 UTC · Levels and zones: Znorva analysis engine
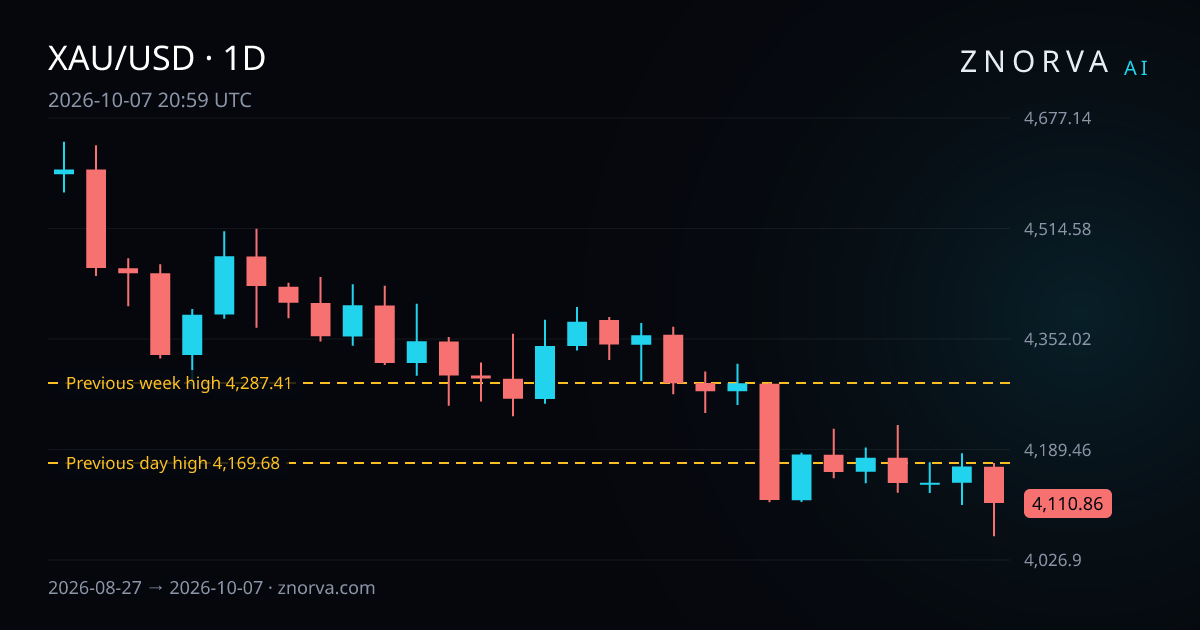
gold price analysis today starts with the key fact: a model setup became active at a reference price of 4110.86. Gold ended 7 October 2026 with a daily close of 4110.86, down -1.28% on the day, and this recap uses the data timestamp 2026-10-07 20:59 UTC. For the live market page, see AI gold analysis.
Gold price snapshot
Gold had a wide session on 7 October 2026. XAU/USD opened at 4164.01, printed a high of 4169.68, fell to 4061.73, and closed at 4110.86. That left a daily move of -1.28% and an intraday range of 2.66%.
The previous session, 6 October 2026, closed at 4164.33. The latest daily close was therefore lower than the prior close, which matches the recorded -1.28% day-on-day move.
Across the last 7 sessions, from 29 September 2026 to 7 October 2026, gold opened that period at 4114.67 and closed it at 4110.86. The period high was 4225.65, the low was 4061.73, and the net change was -0.09%.
The last 30 sessions, from 27 August 2026 to 7 October 2026, show a broader range from 4061.73 to 4642.31. With the latest daily close at 4110.86, gold is sitting much closer to that 30-session low than to the recent high.
Nearest reference levels and zones
All distance readings in this section are measured from the daily close of 4110.86.
The nearest reference levels are both above the market. The closest is the previous day high on the 1H timeframe at 4169.68, which is 1.43% above the latest daily close. The next is the previous week high on the 4H timeframe at 4287.41, which is 4.29% above.
There are no active demand zones or supply zones in the current data. That leaves the structure relatively light and puts more weight on reference levels and liquidity sweep behavior.
The recent sweep record adds context. A liquidity sweep of the previous week low on the 4H timeframe occurred at 4111.8 on 7 October 2026, and that level is already used. On the 1H timeframe, the previous day high at 4170.6 and the previous day low at 4125.41 were also swept on 7 October 2026, but both are marked as expired.
In plain terms, the map is narrow. Gold has two overhead reference levels, no active zones, and several nearby levels that have already done their job in the model.
What changed since yesterday?
The biggest change since 6 October 2026 was the weaker close. Gold moved from a daily close of 4164.33 to 4110.86, a 24-hour change of -1.28%.
The session was also broad. The 24-hour range came in at 2.66%, which shows that the move lower happened with meaningful price travel rather than a quiet drift.
One reference level was touched in that window: the previous day high at 4169.68. The model also recorded one fresh activation, so a model setup became active in the last 24 hours. No model-tracked outcomes were resolved in that same 24-hour window, and six analytical scenarios were invalidated before becoming active.
Over the last 48 hours, no new zones were added. That keeps the focus on the daily close, the overhead highs, and the recent liquidity sweeps rather than on fresh zone structure.
Model-tracked outcomes
Model-tracked outcomes are hypothetical analytical results, not executed trades or customer results. Znorva does not execute trades.
Over the last 30 days, six analytical scenarios were resolved under the model's rules for a combined outcome of 0.23 R. R is the distance between the reference entry and the model's stop level. In that same window, one scenario reached its final target, two produced a partial outcome, zero resolved at breakeven, and three resolved at the model's stop level.
The model is still tracking one scenario as in progress. Outside that small resolved group, 62 scenarios were invalidated before becoming active and 85 expired without becoming active. That mix points to a market with many candidate setups but a much smaller number that fully developed.
Recent resolved examples show the spread of outcomes:
- On 6 October 2026, a 1H short-side scenario became active at a reference price of 4160.81 and resolved under the model's rules at the model's stop level at 4183.83 for -1 R.
- On 5 October 2026, a 15m long-side scenario became active at a reference price of 4134.11 and produced a partial outcome after reaching target 1, then resolved at 4138.81 for 0.56 R.
- On 2 October 2026, a 15m short-side scenario became active at a reference price of 4183.61 and produced a partial outcome after reaching target 1, then resolved at 4183.61 for 0.2 R.
- On 30 September 2026, a 15m short-side scenario became active at a reference price of 4181.88 and resolved at the model's stop level at 4188.5 for -1 R.
- On 30 September 2026, a 30m short-side scenario became active at a reference price of 4177.98 and resolved at the model's stop level at 4189.13 for -1 R.
That recent record is mixed. It does not show a clean run of one-sided follow-through, which fits a market that has active movement but limited fresh structure nearby.
How Znorva AI reads this market
Znorva AI maps reference levels, liquidity sweeps, reclaims, and zone rules across several timeframes. A reclaim needs 2 completed closes back beyond the level. Once that happens, the model can track long-side or short-side scenarios and measure up to 3 targets.
The framework also uses rolling 7-day and 30-day windows to summarize context and outcomes. For gold right now, that reading is straightforward: the daily close is 4110.86, one model setup became active at that same reference price, no active zones are present, and the nearest reference levels are above at 4169.68 and 4287.41.
If you want the same framework on other markets, see the AI forex analysis blog and this EURUSD, GBPUSD, and XAUUSD recap.
FAQ
Why does gold price analysis today focus on 4110.86?
Because 4110.86 is the latest daily close and the reference price where one model setup became active. It is also the base used for all distance readings in this recap.
Where are the nearest reference levels right now?
The nearest reference levels are the previous day high at 4169.68 and the previous week high at 4287.41. They sit 1.43% and 4.29% above the latest daily close.
What do the recent model-tracked outcomes show?
The last 30 days show six resolved scenarios for a combined 0.23 R. That includes one final target reached, two partial outcomes, and three outcomes that resolved at the model's stop level.