What is a liquidity sweep in trading? How it works on a chart
Data as of 2026-10-06 23:59 UTC · Levels and zones: Znorva analysis engine
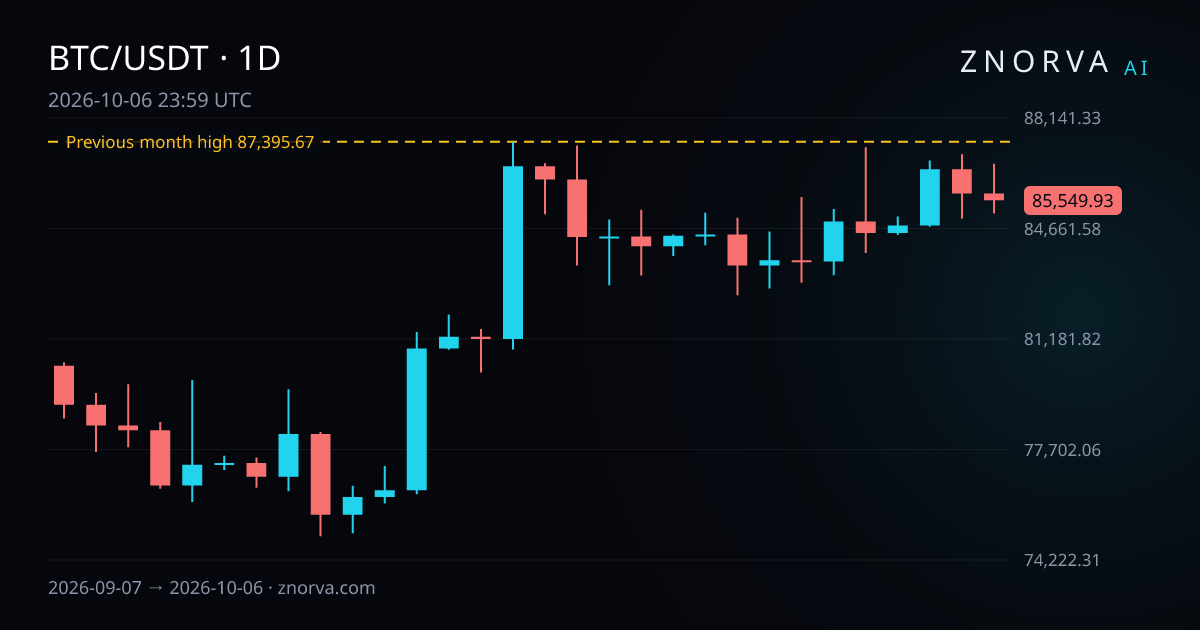
What is a liquidity sweep in trading? It is a move through a visible reference level that loses follow-through and then reclaims that level. Traders usually look for it around a previous day, week, or month high or low. In Znorva AI, the idea only becomes useful when the chart prints a reclaim with 2 completed closes back beyond the level. This guide uses data current to 2026-10-06 23:59 UTC and explains how the method tracks that pattern.
What it is
A liquidity sweep happens when price pushes beyond a reference level, draws attention around that area, and then moves back beyond it. The reference level can be a previous day high, previous week low, or previous month high or low. These are levels many traders can see, so they often attract clustered orders.
The important detail is the reclaim. In Znorva AI, a reclaim means 2 completed closes back beyond the level. Without that, a move through a high or low may just be a normal breakout attempt. With that reclaim, the chart can shift from simple continuation to a more structured setup.
That is why traders separate a sweep from a breakout. A breakout tries to hold beyond the level. A sweep fails to hold beyond it and then flips back. If you want the wider context around sweeps, failed breaks, and structure shifts, see our smart money concepts and market structure guide.
How to spot it on a chart
Start with clear reference levels on a higher timeframe. Previous day, week, and month highs and lows are the simplest starting point. Then drop to a lower timeframe to see whether price moved through the level, stalled, and came back beyond it. If you want a rules-based chart read, Znorva also offers AI chart reading.
A simple checklist helps. First, mark the reference level. Second, wait for price to move through it. Third, check whether price reclaims that level with 2 completed closes back beyond it. If that does not happen, the move does not meet the method's definition.
Nearest reference levels matter because they show where a sweep may form next. On Bitcoin, the previous month high on the 1D timeframe sits at 87,395.67 USDT. That reference level is 2.16% above the daily close of 85,549.93 USDT on 6 October 2026. When a market reaches a widely visible level like that, the next question is not just whether it broke, but whether it can hold beyond the level.
How Znorva AI uses it (the method)
In the Znorva methodology, the engine starts with a calendar-based reference high or low. After the sweep, it waits for a reclaim with 2 completed closes back beyond the level. Only after that does it look for an entry zone, with priority in this order: BPR, IFVG, FVG.
The model tracks 3 targets for each active scenario. It also measures results in R. R is the distance between the reference entry and the model's stop level. Using R makes outcomes easier to compare across different markets and chart prices.
Zones add another filter. A demand zone can support a long-side scenario after a reclaim. A supply zone can cap a short-side scenario after a reclaim. Znorva also uses the Whale Zone scan to frame where those reactions may matter.
This matters because a sweep alone is not enough. Some scenarios are invalidated before becoming active. Others expire without becoming active. The method is built to reject many raw ideas and only keep the ones that still fit its rules after the reclaim and zone checks.
A real example from our data
The recent record shows how selective the process is. Over the last 60 days, 14 setups were resolved under the model's rules. Of those, 2 had a target reached outcome, 3 had a partial outcome, and 9 resolved at the model's stop level. Over the last 30 days, 970 scenarios were invalidated before becoming active.
One BTCUSDT example came from crypto futures on the 1H timeframe. It was a short-side scenario. The setup became active at a reference price of 86,107 USDT on 5 October 2026. It was resolved under the model's rules on 7 October 2026 at 84,328.9 USDT. The hypothetical model-tracked outcome was target reached, equal to 1.65 R.
That example shows how the method uses a sweep in practice. First, a visible level attracts attention. Next, the reclaim helps show that the move beyond the level did not hold. Then the engine tracks the setup with fixed rules instead of treating every break of a high or low as the same chart event.
Common mistakes
The first mistake is calling every move through a high or low a liquidity sweep. A sweep needs the reclaim. If price stays beyond the level, that is a different condition. The second mistake is using random highs and lows instead of clean reference levels such as previous day, week, or month extremes.
Another mistake is skipping the filters after the reclaim. In Znorva AI, the reclaim alone does not make a setup active. The model still checks the entry-zone order of BPR, IFVG, and FVG, and it still uses demand or supply context. That extra filtering helps explain why 970 scenarios were invalidated before becoming active in the last 30 days.
A final mistake is focusing only on the best outcomes. The recent data shows both sides of the record: 2 target reached outcomes, 3 partial outcomes, and 9 cases that resolved at the model's stop level over 60 days. A useful chart method has to describe both the positive outcome cases and the failed ones with the same terms.
FAQ
What is a liquidity sweep in trading in simple terms?
It is a move through a clear reference level that fails to hold and then reclaims that level. In Znorva AI, the reclaim means 2 completed closes back beyond the level.
Does every sweep lead to a reclaim?
No. Some moves keep going and never reclaim the level. Others do reclaim it, but still fail other filters and are invalidated before becoming active.
Why does Znorva AI use R instead of raw price moves?
R gives one consistent way to compare outcomes. In the method, R is the distance between the reference entry and the model's stop level, so 1.65 R describes the outcome size without depending on the chart's absolute price.