Ethereum Price Analysis Today: 5 setups invalidated before becoming active, 2389.14 close, 23 October 2026
Data as of 2026-10-22 23:59 UTC · Levels and zones: Znorva analysis engine
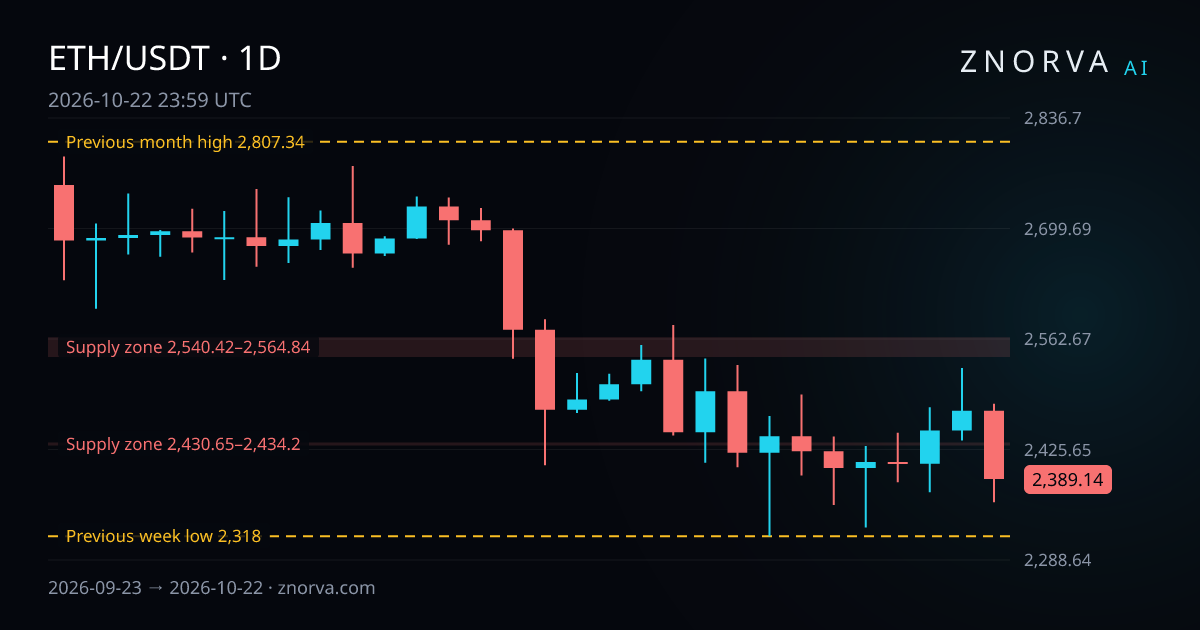
ethereum price analysis today starts with 5 setups invalidated before becoming active and a daily close of 2389.14. Ethereum finished 22 October 2026 with a -3.42% move, and no tracked reference level was touched in the latest 24-hour update. Data timestamp: 2026-10-22 23:59 UTC.
Ethereum price snapshot
Ethereum opened at 2473.77, reached 2482.49, fell to 2360.32, and closed at 2389.14 on 22 October 2026. The day’s range was 5.18%, which shows a wide session around a lower close.
The previous daily close was 2473.76 on 21 October 2026. That means the latest session continued lower, which matches the reported -3.42% daily change.
Across the last 7 sessions, from 16 October 2026 to 22 October 2026, Ethereum opened at 2442.07 and closed at 2389.14. The highest price in that window was 2526.62, the lowest was 2329, and the full 7-session move was -2.17%.
The last 30 sessions, from 23 September 2026 to 22 October 2026, recorded a high of 2789 and a low of 2318. The latest daily close of 2389.14 sits inside that range.
Nearest reference levels and zones
All distance figures below are measured from the daily close of 2389.14.
The nearest reference levels are one above and one below. The previous month high reference level is 2807.34 on the 1D timeframe, which is 17.5% above the latest daily close. The previous week low reference level is 2318 on the 4H timeframe, which is 2.98% below the latest daily close.
The nearest overhead zone is a 4H supply zone from 2430.65 to 2434.2, formed on 22 October 2026. It is classified Strong by the engine and sits 1.74% above the daily close. A higher 4H supply zone runs from 2540.42 to 2564.84, formed on 12 October 2026, also classified Strong by the engine and 6.33% above.
Below the market, the nearest demand zone is on the 1D timeframe from 1923.27 to 2221.54. It was formed on 20 August 2026, is classified Strong by the engine, and is 7.02% below the daily close. A deeper 1D demand zone sits from 1885.78 to 1923.27, formed on 19 August 2026, also classified Strong by the engine and 19.5% below.
No liquidity sweep was logged at the tracked reference levels in this snapshot.
What changed since yesterday?
The daily close changed from 2473.76 on 21 October 2026 to 2389.14 on 22 October 2026. That kept the latest 24-hour move at -3.42%.
The session range reached 5.18%. Even with that wider movement, the tracked data still shows no reference level touch in the latest 24-hour update.
The zone map also changed. One new zone was added in the last 48 hours, and that new zone is the nearby 4H supply zone from 2430.65 to 2434.2, formed on 22 October 2026.
On the model side, no setups became active in the last 24 hours and none resolved under the model’s rules in that same window. Instead, 5 setups were invalidated before becoming active. That is the main fact of the day.
Model-tracked outcomes
Model-tracked outcomes are hypothetical analytical results, not executed trades or customer results. Znorva does not execute trades.
Across the last 30 days, the model tracked 7 resolved setups. Of those, 1 reached its final target, 2 were partial outcomes, 0 resolved at breakeven, and 4 resolved at the model’s stop level. The combined outcome across those resolved setups was 1.14 R.
R is the distance between the reference entry and the model’s stop level. A total of 1.14 R means the resolved group was slightly positive over that 30-day sample, even though stop-level resolutions outnumbered full target reaches.
There are 3 setups still tracked by the model. Outside the resolved group, 49 setups were invalidated before becoming active and 35 expired without becoming active.
Recent hypothetical model-tracked outcomes add context:
- A 15m short-side scenario in crypto futures became active at a reference price of 2466.96 on 16 October 2026 and resolved under the model’s rules on 18 October 2026 as a partial outcome after reaching target 1, for 2.08 R.
- A 15m short-side scenario in crypto futures became active at a reference price of 2556.89 on 12 October 2026 and reached its final target on 12 October 2026, for 1.9 R.
- A 1H long-side scenario in crypto spot became active at a reference price of 2711.05 on 5 October 2026 and resolved at the model’s stop level on 7 October 2026, for -1 R.
- A 1H long-side scenario in crypto futures became active at a reference price of 2710 on 5 October 2026 and resolved at the model’s stop level on 7 October 2026, for -1 R.
- A 15m short-side scenario in crypto futures became active at a reference price of 2720.3 on 2 October 2026 and resolved at the model’s stop level on 2 October 2026, for -1 R.
That recent sample shows better short-side outcomes than long-side outcomes, while the broader 30-day record still includes both positive and negative results.
How Znorva AI reads this market
Znorva maps reference levels, zones, liquidity sweeps, and reclaims and pairs that with AI crypto analysis, AI chart analysis, and a broader guide to AI crypto analysis for Bitcoin, Ethereum and altcoins.
In this method, a reclaim needs 2 completed closes back beyond a reference level. The model also tracks 3 targets when a valid setup becomes active, and it compares a 7-session view with a 30-session view.
For Ethereum, the latest daily close is below the nearest 4H supply zone and above the previous week low reference level. No liquidity sweep is logged, no reclaim is confirmed in the tracked reference-level data, and the last 24 hours were defined by invalidations rather than new active setups.
The map is tighter above price than below it. The nearest supply zone is 1.74% above the daily close, while the nearest downside reference level is 2.98% below and the nearest demand zone is 7.02% below.
FAQ
Why were 5 setups invalidated before becoming active?
The model recorded 5 invalidations in the latest 24-hour window. That means those setups no longer met the rules before they became active at a reference price.
Where are the nearest reference levels and zones now?
The nearest downside reference level is the previous week low at 2318, which is 2.98% below the daily close. The nearest overhead zone is the 4H supply zone from 2430.65 to 2434.2, which is 1.74% above.
What does ethereum price analysis today show about market structure?
It shows nearby overhead supply and no logged liquidity sweep at tracked reference levels. It also shows that the latest 24 hours were shaped by invalidations, not by new active setups or newly resolved outcomes.