Bitcoin Price Analysis Today: 2 setups resolved, daily close 81,938.4, 20 October 2026
Data as of 2026-10-19 23:59 UTC · Levels and zones: Znorva analysis engine
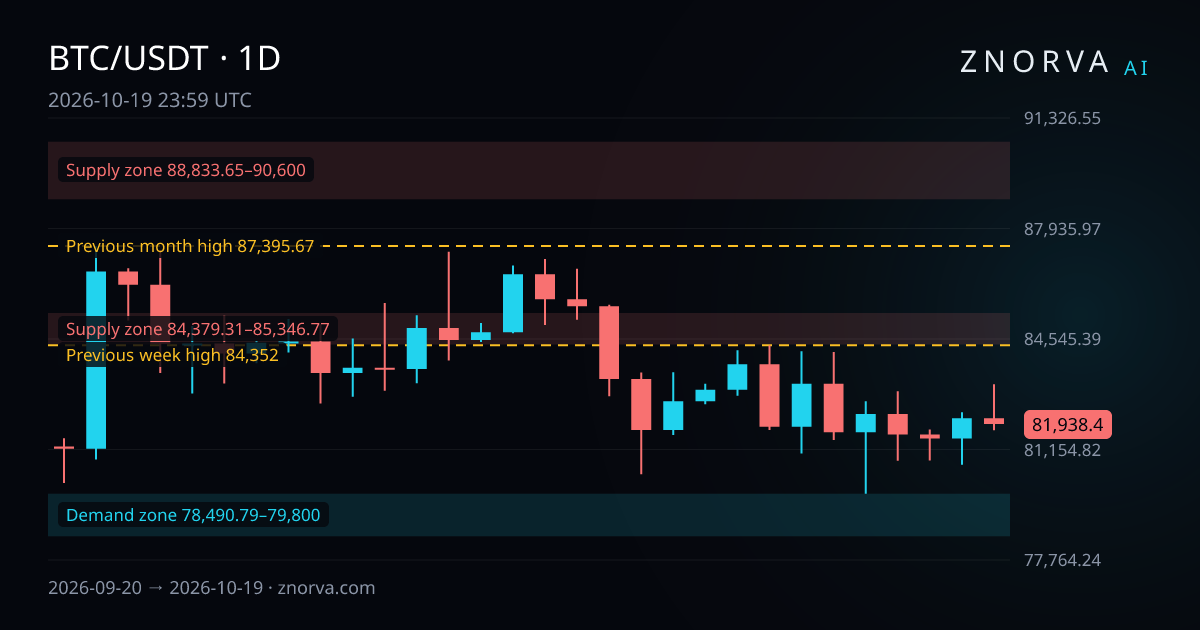
bitcoin price analysis today starts with the main fact: 2 model-tracked setups were resolved under the model's rules, and BTC/USDT posted a daily close of 81,938.4. This update uses data stamped 2026-10-19 23:59 UTC. For the wider market map, see the Bitcoin hub and the broader crypto market page.
Bitcoin price snapshot
Bitcoin ended 19 October 2026 with a daily close of 81,938.4 on BTC/USDT. The session opened at 82,116, reached 83,158, fell to 81,748.85, and finished at 81,938.4. The daily close changed by -0.22%, and the full session range was 1.72%.
The previous daily close on 18 October 2026 was 82,116. That means the new session started exactly where the prior one finished, then traded both sides before ending slightly above the session low.
The 7-session view stayed nearly flat overall. From 13 October 2026 to 19 October 2026, Bitcoin opened at 81,850.01, printed a high of 84,168, traded as low as 79,800, and closed at 81,938.4. The net change across that span was 0.11%.
The 30-session range remains much wider than the latest day. From 20 September 2026 to 19 October 2026, the highest print was 87,395.67 and the lowest was 79,800. The latest daily close sits inside that range, with no new 30-session extreme set on 19 October 2026.
Nearest reference levels and zones
All distances below are measured from the daily close of 81,938.4. For zones, the distance is measured to the nearest edge of the zone.
Nearest reference levels
- Previous week high on the 4H timeframe: 84,352. Distance from the daily close: 2.95% above.
- Previous month high on the 1D timeframe: 87,395.67. Distance from the daily close: 6.66% above.
Demand and supply zones
- 4H demand zone: 78,490.79 to 79,800. It is classified Strong by the engine. Distance from the daily close: 2.61% below. Formed on 18 September 2026.
- 1D demand zone: 75,064.82 to 77,179.47. It is classified Strong by the engine. Distance from the daily close: 5.81% below. Formed on 21 September 2026.
- 4H supply zone: 84,379.31 to 85,346.77. It is classified Strong by the engine. Distance from the daily close: 2.98% above. Formed on 7 October 2026.
- 1D supply zone: 88,833.65 to 90,600. It is classified Strong by the engine. Distance from the daily close: 8.42% above. Formed on 30 January 2026.
The nearest upside reference level is the previous week high at 84,352. Just above that, the nearest supply zone begins at 84,379.31. On the downside, the closest demand zone starts at 79,800. No liquidity sweep was recorded around the nearest reference levels in this update.
What changed since yesterday?
The main shift over the last 24 hours was in model-tracked outcomes, not in the market map. In that window, 2 setups were resolved under the model's rules. No new setup became active, and 2 setups were invalidated before becoming active.
Price action itself stayed contained. The daily close changed by -0.22%, while the session range was 1.72%. No nearest reference levels were touched, and no new zone was added in the last 48 hours.
That leaves the broader structure largely unchanged. The same two upside reference highs remain overhead, while the same two demand zones and two supply zones still define the nearby framework.
Model-tracked outcomes
Model-tracked outcomes are hypothetical analytical results, not executed trades or customer results. Znorva does not execute trades.
Over the last 30 days, 11 Bitcoin setups were resolved under the model's rules. Within that group, 1 reached its final target, 3 had a partial outcome, 0 resolved at breakeven, and 7 resolved at the model's stop level. The net hypothetical model-tracked outcome across those resolved setups was -3.07 R. Two setups are still tracked by the model, while 45 were invalidated before becoming active and 34 expired without becoming active.
R is the distance between the reference entry and the model's stop level. A result of 1 R equals that full distance, while -1 R means the setup resolved at the model's stop level.
The recent record shows a mixed stretch:
- A 1H long-side scenario in crypto spot became active at a reference price of 81,755.01 on 16 October 2026. It was resolved under the model's rules on 19 October 2026 with a partial outcome after reaching target 1 (TP1), for 0.26 R.
- A 1H long-side scenario in crypto futures became active at a reference price of 81,720.3 on 16 October 2026. It was resolved under the model's rules on 19 October 2026 with a partial outcome after reaching target 1 (TP1), for 0.25 R.
- A 1H short-side scenario in crypto futures became active at a reference price of 81,747.4 on 18 October 2026. It was resolved under the model's rules on 19 October 2026 at the model's stop level, for -1 R.
- A 15m short-side scenario in crypto futures became active at a reference price of 82,359.6 on 16 October 2026. It was resolved under the model's rules later that day with a partial outcome after reaching target 1 (TP1), for 1.76 R.
- A 4H long-side scenario in crypto spot became active at a reference price of 82,318 on 9 October 2026. It was resolved under the model's rules on 15 October 2026 at the model's stop level, for -1 R.
How Znorva AI reads this market
Znorva AI uses reference levels, liquidity sweeps, and reclaim rules to frame the market. A reclaim means 2 completed closes back beyond the level. The model works with 3 targets and tracks results across 7-day and 30-day windows. For a fuller walkthrough, see how to analyze BTC with AI.
Right now, Bitcoin sits below the nearest upside reference level at 84,352 and below the nearest 4H supply zone that starts at 84,379.31. On the downside, the closest demand zone begins at 79,800. With no touched reference levels in the latest change window and no new zone in 48 hours, the engine is reading location inside an existing map rather than a fresh structural break.
That matters because the current picture is balanced between overhead supply and lower demand. The latest daily close at 81,938.4 did not reclaim an upside reference level, and it did not push into the nearest demand zone. In simple terms, the market remains between known boundaries while short-term model outcomes continue to update inside that range.
FAQ
What is the key takeaway from bitcoin price analysis today?
The key takeaway is that Bitcoin finished 19 October 2026 with a daily close of 81,938.4, and 2 model-tracked setups were resolved under the model's rules in the last 24 hours.
Where are the nearest reference levels for BTC/USDT?
The nearest reference levels are both above the latest daily close. The previous week high at 84,352 is 2.95% above, and the previous month high at 87,395.67 is 6.66% above.
What does -3.07 R mean in the model record?
It means the net hypothetical model-tracked outcome across resolved setups in the last 30 days was -3.07 times the model's stop distance. R is the distance between the reference entry and the model's stop level.