Bitcoin Price Analysis Today: 1 model setup became active at 81,850, 13 October 2026
Data as of 2026-10-12 23:59 UTC · Levels and zones: Znorva analysis engine
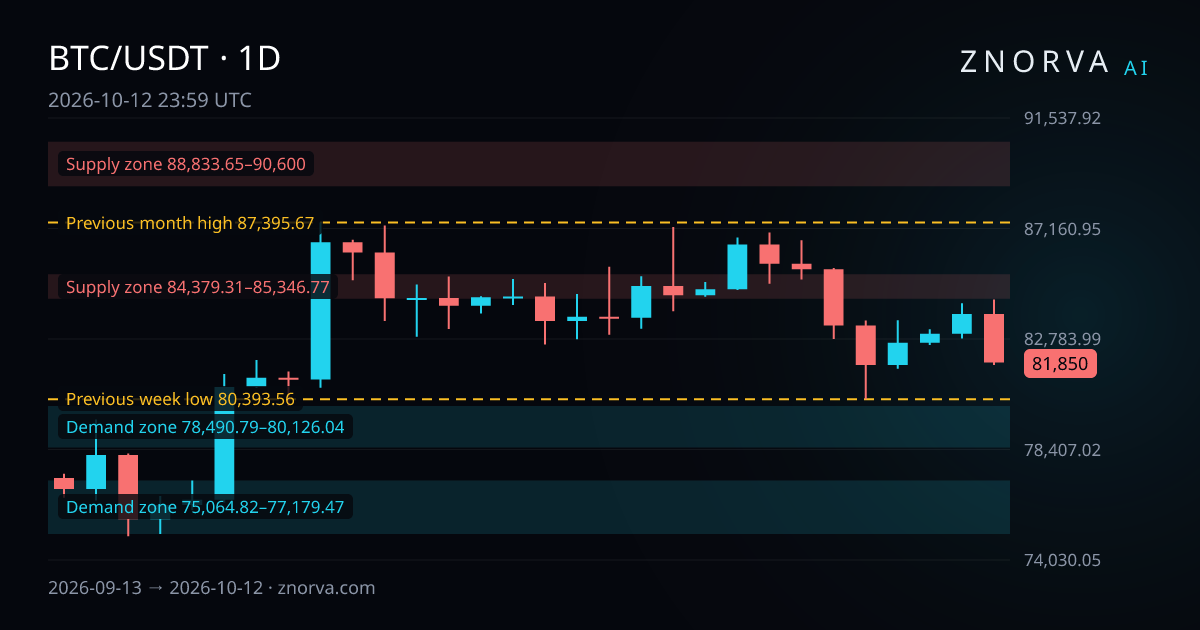
bitcoin price analysis today starts with one clear fact: a model setup became active at a reference price of 81,850. Bitcoin ended 12 October 2026 with a daily close of 81,850, down -2.3% on the day, and the data timestamp is 2026-10-12 23:59 UTC. The session high was 84,352, the low was 81,750.09, and the full day range was 3.18%.
Bitcoin price snapshot
BTC/USDT opened 12 October 2026 at 83,773.12 and closed at 81,850. That was below the 11 October 2026 close of 83,773.12, so the latest session finished weaker than the day before.
Key numbers from the latest reading:
- 12 October 2026: open 83,773.12, high 84,352, low 81,750.09, close 81,850, change -2.3%, range 3.18%.
- 6 October 2026 to 12 October 2026: open 85,766.87, high 86,698.99, low 80,393.56, close 81,850, change -4.57%.
- 13 September 2026 to 12 October 2026: high 87,395.67, low 74,967.97.
That puts the latest daily close below the 7-session opening level of 85,766.87. It also leaves BTC well inside the wider 30-session range between 74,967.97 and 87,395.67. The same market view appears on the Bitcoin market page.
Nearest reference levels and zones
Distances below are measured from the daily close of 81,850.
Nearest reference levels:
- Previous week low on 4H: 80,393.56, which is 1.78% below.
- Previous month high on 1D: 87,395.67, which is 6.78% above.
Nearest zones:
- 4H demand zone: 78,490.79 to 80,126.04. It is classified Strong by the engine and is 2.11% below. It formed on 18 September 2026.
- 1D demand zone: 75,064.82 to 77,179.47. It is classified Strong by the engine and is 5.71% below. It formed on 21 September 2026.
- 4H supply zone: 84,379.31 to 85,346.77. It is classified Strong by the engine and is 3.09% above. It formed on 7 October 2026.
- 1D supply zone: 88,833.65 to 90,600. It is classified Strong by the engine and is 8.53% above. It formed on 30 January 2026.
No liquidity sweep was logged in the latest data. That leaves the previous week low as the closest reference level below the market, while the nearest overhead zone is the 4H supply area that starts at 84,379.31.
What changed since yesterday?
The biggest change was the daily close itself. Bitcoin moved from a 11 October 2026 close of 83,773.12 to a 12 October 2026 close of 81,850. That was a -2.3% day, with a 3.18% session range.
The broader structure changed less than the price did:
- No nearest reference levels were touched in the last 24 hours.
- No new zones were added in the last 48 hours.
- 1 setup became active in the last 24 hours.
- 1 setup resolved under the model's rules in the last 24 hours.
- 6 setups were invalidated before becoming active in the last 24 hours.
This matters because the market moved sharply lower on the day, but the structural map did not expand with a new zone or a logged liquidity sweep. In plain terms, there was fresh model activity, but the same nearby reference level below and the same supply zone above still define the short-term map.
Model-tracked outcomes
Model-tracked outcomes are hypothetical analytical results, not executed trades or customer results. Znorva does not execute trades.
Over the last 30 days, 5 setups resolved under the model's rules. Of those 5, 1 reached its final target, 0 had a partial outcome, 0 resolved at breakeven, and 4 resolved at the model's stop level. Net outcome across those resolved setups was -2.35 R. R is the distance between the reference entry and the model's stop level. The model is still tracking 2 setups in progress.
The filter has also ruled out many scenarios before activation. Over the last 14 days, 30 setups were invalidated before becoming active. Over the last 30 days, 28 expired without becoming active. That points to a selective process rather than constant setup flow.
Recent resolved setups:
- 15m short-side scenario in crypto futures: became active at a reference price of 83,969.4 on 12 October 2026 and resolved at the model's stop level at 84,295.62 on 12 October 2026 for -1 R.
- 1H short-side scenario in crypto futures: became active at a reference price of 82,687.9 on 10 October 2026 and resolved at the model's stop level at 83,607.12 on 11 October 2026 for -1 R.
- 1H short-side scenario in crypto futures: became active at a reference price of 86,107 on 5 October 2026 and reached its final target at 84,328.9 on 7 October 2026 for 1.65 R.
- 1H long-side scenario in crypto spot: became active at a reference price of 83,950 on 24 September 2026 and resolved at the model's stop level at 82,703.78 on 28 September 2026 for -1 R.
- 1H long-side scenario in crypto futures: became active at a reference price of 83,907.9 on 24 September 2026 and resolved at the model's stop level at 82,655.5 on 28 September 2026 for -1 R.
How Znorva AI reads this market
Znorva reads this market with a rules-based process built around liquidity sweep, reclaim, and zone logic. A reclaim means 2 completed closes back beyond a reference level. After that, the engine ranks demand and supply zones, tracks when a setup became active, and follows up to 3 targets. The broader AI crypto analysis hub uses the same framework across markets.
For Bitcoin, the latest daily close sits 1.78% above the previous week low and 2.11% above the nearest 4H demand zone. On the upside, the nearest 4H supply zone starts 3.09% above the latest close. With no liquidity sweep logged, this reading is about how BTC behaves between known structure points rather than a fresh structural reset.
That makes the current map simple. There is nearby support-type structure below at the previous week low and the 4H demand zone, while overhead supply starts at 84,379.31. If you want a step-by-step BTC example of the same process, see how to analyze BTC with AI.
FAQ
What does bitcoin price analysis today show for BTC?
It shows Bitcoin closing 12 October 2026 at 81,850 after a -2.3% session. It also shows that a model setup became active at a reference price of 81,850.
Where are the nearest reference levels and zones?
The nearest reference levels are the previous week low at 80,393.56 and the previous month high at 87,395.67. The closest zones are the 4H demand zone at 78,490.79 to 80,126.04 and the 4H supply zone at 84,379.31 to 85,346.77.
How have recent model-tracked outcomes looked?
The last 30 days show 5 resolved setups with a net outcome of -2.35 R. Only 1 reached its final target, while 4 resolved at the model's stop level.