Bitcoin Price Analysis Today for 6 October 2026
Data as of 2026-10-05 23:59 UTC · Levels and zones: Znorva analysis engine
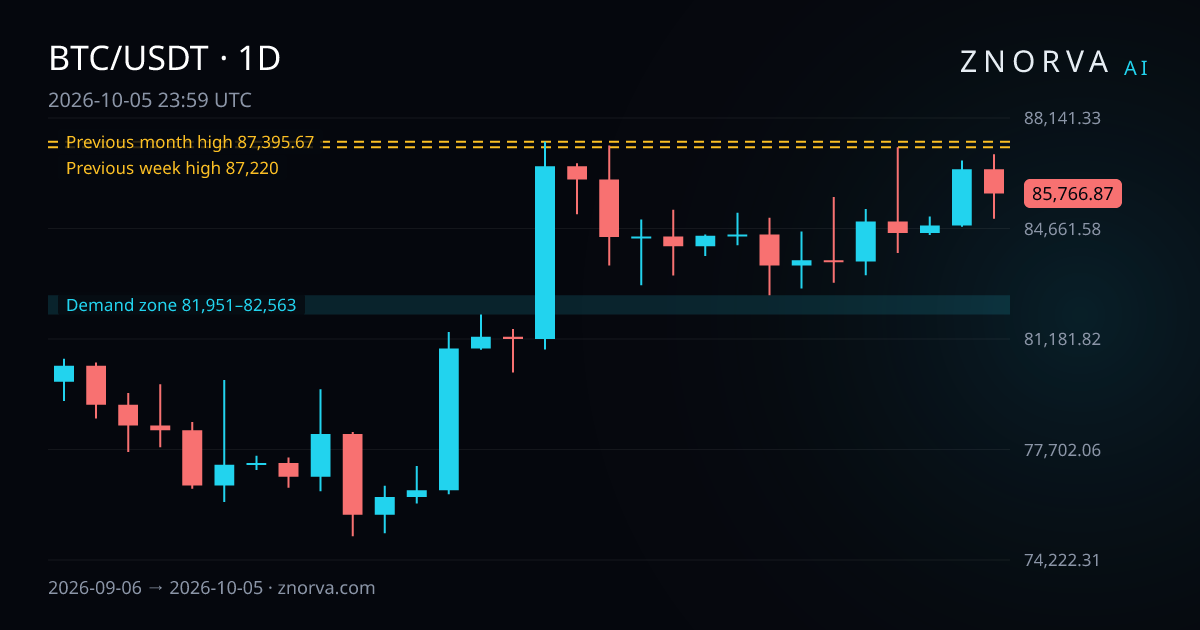
Bitcoin price analysis today focuses on BTC/USDT after a lower daily close. The data timestamp for this update is 2026-10-05 23:59 UTC. The latest 1d engine check placed Bitcoin at 85,766.87 USDT. If you want the broader market page for this symbol, see Bitcoin analysis with AI.
Price snapshot for bitcoin price analysis today
Bitcoin closed 5 October 2026 at 85,766.87 USDT. The session opened at 86,530 USDT, reached 86,999.11 USDT, fell to 84,972.01 USDT, and then finished near the lower half of the day’s range.
That left the daily close down 0.88%. The session range was 2.39%. On 4 October 2026, BTC/USDT closed at 86,530 USDT after trading between 84,719.99 USDT and 86,800 USDT.
The last 7 sessions still show a net rise. From 29 September 2026 to 5 October 2026, BTC/USDT moved from 83,500.01 USDT to 85,766.87 USDT, a gain of 2.71%. In that same window, price reached 87,220 USDT at the high and 82,775.94 USDT at the low.
The 30-session range remains wide. From 6 September 2026 to 5 October 2026, Bitcoin traded between 74,967.97 USDT and 87,395.67 USDT. That keeps nearby overhead highs important while leaving a large gap to deeper demand below.
Znorva levels and zones to watch
The nearest upside markers in the current dataset are both prior highs. These are the main prices to watch above the current market:
- Previous month high on the 1d view: 87,395.67 USDT, 1.9% away.
- Previous week high on the 4h view: 87,220 USDT, 1.99% away.
No recent sweep is listed in the current data, so the focus stays on whether Bitcoin can revisit these highs or react before reaching them. The engine also tracks three strong zones that frame the nearby downside and the next major overhead area:
- Strong 1w demand zone: 81,951 USDT to 82,563 USDT, formed on 4 October 2026 and 3.74% away.
- Strong 1d demand zone: 70,000 USDT to 73,027.02 USDT, formed on 21 August 2026 and 14.85% away.
- Strong 1d supply zone: 92,870 USDT to 93,615.4 USDT, formed on 20 January 2026 and 8.28% away.
The weekly demand zone is the closest strong support area in this read. The daily supply zone sits much higher, but it is still the main overhead zone in the current dataset.
What changed since yesterday
The clearest change is the daily close. BTC/USDT finished 5 October 2026 at 85,766.87 USDT after 4 October 2026 closed at 86,530 USDT. The model records that move as a 0.88% daily decline.
Price still moved enough to matter inside the session. The range was 2.39%, yet no watched high or low was touched in the last 24 hours. The engine also logged 0 new zones in the last 48 hours.
Setup flow was quiet. The engine opened 1 new setup in the last 24 hours, while 0 setups closed and 0 were invalidated. That means fresh structure appeared, but there was no finished outcome added during the day.
Previous setup outcomes
Recent closed results are weak. In the last 30 days, the engine closed 2 Bitcoin setups. Both ended stopped out for a net result of -2 R. There were 0 target hits, 0 partial wins, and 0 breakeven outcomes in that closed group.
There is still 1 setup in progress. Outside the closed group, 57 ideas were invalidated and 53 expired. That tells you the model filters aggressively and does not count an idea as active once its rules stop matching price behavior.
The two most recent closed setups were:
- Crypto spot, 1h, long: opened on 24 September 2026 at 83,950 USDT and closed on 28 September 2026 at 82,703.78 USDT for -1 R.
- Crypto futures, 1h, long: opened on 24 September 2026 at 83,907.9 USDT and closed on 28 September 2026 at 82,655.5 USDT for -1 R.
Those outcomes matter because the recent record does not show successful upside follow-through yet. In this context, the nearby highs and the weekly demand zone matter more than any claim of strong momentum.
How Znorva AI reads this market
Znorva AI studies price in 7-day and 30-day windows. The method waits for a reclaim confirmed by 2 closes, then tracks 3 targets. In this Bitcoin read, the model shows two nearby upside highs, three strong zones, and no recent sweep in the current dataset.
For the step-by-step process, read how to analyze BTC with AI. If you want wider market coverage beyond Bitcoin, see AI crypto analysis.
FAQ
Is Bitcoin still up over the last 7 sessions?
Yes. BTC/USDT moved from 83,500.01 USDT on 29 September 2026 to 85,766.87 USDT on 5 October 2026, which is a 2.71% rise. The latest daily session was still down 0.88%.
Which areas matter most around the current price?
Above price, the model highlights the previous month high at 87,395.67 USDT and the previous week high at 87,220 USDT. Below price, the nearest strong demand zone is 81,951 USDT to 82,563 USDT.
Where can I follow the latest BTC engine view?
You can check the live BTCUSDT analyzer for the newest engine read. If you want workspace access, start a trial.