Weekly crypto and gold market recap: ETH down 6.97%, Gold up 0.91%, 12 October 2026
Data as of 2026-10-11 23:59 UTC · Levels and zones: Znorva analysis engine
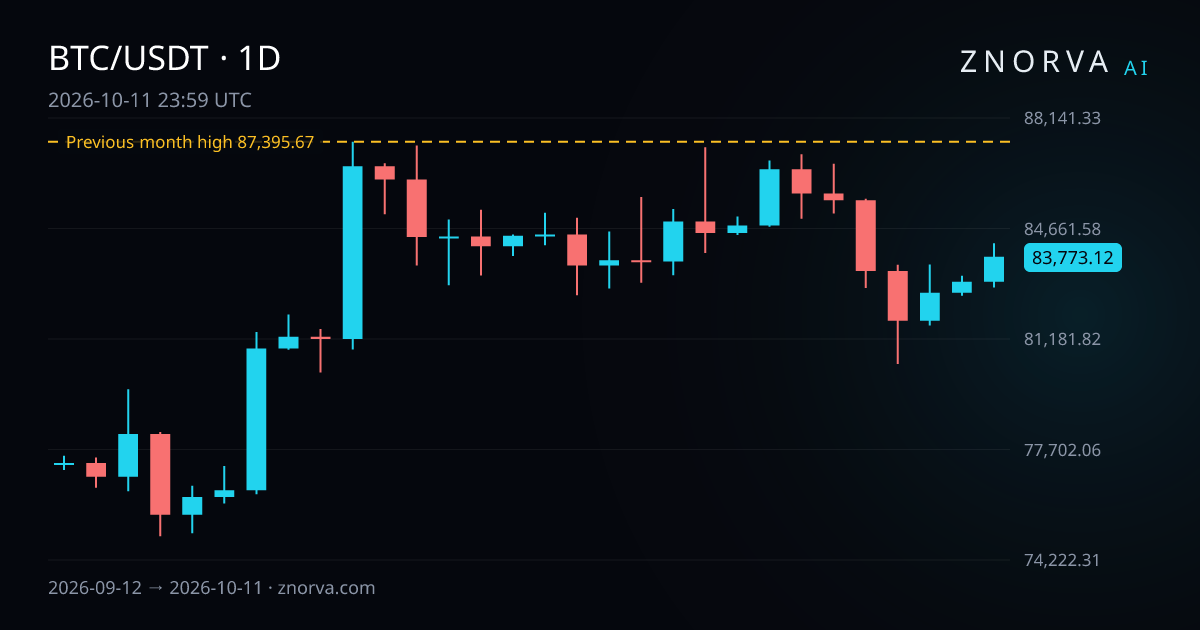
This weekly crypto and gold market recap uses data stamped 2026-10-11 23:59 UTC. The week split into two themes. Crypto closed lower, while Gold held a gain and EUR/USD drifted down. For the same chart structure on digital assets, see the crypto market reading.
Bitcoin
Bitcoin fell over the week from 5 October 2026 to 11 October 2026. BTC/USDT opened at 86,530, reached 86,999.11, dropped to 80,393.56, and closed at 83,773.12. That left the weekly change at -3.19%.
The last daily session ended with a bounce. On 11 October 2026, Bitcoin rose 0.95% and posted a 1.68% daily range. Even after that move, the market still closed far below the weekly high. Its nearest reference level is the previous month high on 1D at 87,395.67. That level sits 4.32% above the latest daily close.
Ethereum
Ethereum had the sharpest weekly drop in this recap from 5 October 2026 to 11 October 2026. ETH/USDT opened at 2,726.93, printed 2,738, traded down to 2,406.11, and closed at 2,536.94. The weekly change was -6.97%.
The final daily session was firmer, but it did not reverse the broader move. On 11 October 2026, Ethereum gained 1.21% and recorded a 2.3% daily range. Its nearest reference level is the previous month low on 1D at 2,356.41. That level stands 7.12% below the latest daily close.
Gold
Gold was the only market here with a weekly gain. From 1 October 2026 to 9 October 2026, XAU/USD opened at 4,156.84, hit 4,225.65, dipped to 4,061.73, and closed at 4,194.48. That produced a weekly change of 0.91%.
The last daily move added to that advance. On 9 October 2026, Gold rose 1.47% with a 1.84% daily range. Its nearest reference level is the previous week low on 4H at 4,061.73. That level is 3.16% below the latest daily close. If you want the same format focused on bullion, use the gold market reading.
EUR/USD
EUR/USD also finished the week lower. From 1 October 2026 to 9 October 2026, the pair opened at 1.13298, reached 1.1337, fell to 1.11617, and closed at 1.12025. The weekly change came in at -1.12%.
Late-week movement was quieter than in the other markets. On 9 October 2026, EUR/USD slipped -0.08% and traded through a 0.49% daily range. Its nearest reference level is the previous month high on 1D at 1.16538. That level remains 4.03% above the latest daily close.
Model-tracked outcomes this week
Model-tracked outcomes are hypothetical analytical results, not executed trades or customer results. Znorva does not execute trades.
Across the model’s 7-day window, 9 setups resolved under the model’s rules. Net outcome was 1.74 R. R is the distance between the reference entry and the model’s stop level (1 R). You can review the rule set on the methodology page.
Of those 9 resolved setups, 2 had a target reached outcome, 3 had a partial outcome, 0 resolved at breakeven, and 4 resolved at the model’s stop level. The model still tracks 2 setups as in progress. Outside those resolved results, 62 were invalidated before becoming active and 51 expired without becoming active.
Recent examples show the mix across markets and timeframes:
- BTC/USDT, 1H, short-side scenario: became active at a reference price of 82,687.9 on 10 October 2026 and resolved at the model’s stop level on 11 October 2026 for -1 R.
- XAU/USD, 15m, long-side scenario: became active at a reference price of 4,114.55 on 7 October 2026 and resolved with a target reached outcome on 9 October 2026 for 1.21 R.
- EUR/USD, 1H, long-side scenario: became active at a reference price of 1.12 on 8 October 2026 and resolved with a partial outcome on 8 October 2026 for 0.19 R.
- EUR/USD, 15m, short-side scenario: became active at a reference price of 1.12556 on 6 October 2026 and resolved with a partial outcome on 7 October 2026 for 2.12 R.
- BTC/USDT, 1H, short-side scenario: became active at a reference price of 86,107 on 5 October 2026 and resolved with a target reached outcome on 7 October 2026 for 1.65 R.
Nearest reference levels for next week
Each distance below is measured from that market’s latest daily close. In this framework, a reclaim means 2 completed closes back beyond the level. The multi-timeframe reading explains why a 1D level and a 4H level can shape price differently.
- Bitcoin: previous month high on 1D at 87,395.67; 4.32% above.
- Ethereum: previous month low on 1D at 2,356.41; 7.12% below.
- Gold: previous week low on 4H at 4,061.73; 3.16% below.
- EUR/USD: previous month high on 1D at 1.16538; 4.03% above.
FAQ
What stands out in this weekly crypto and gold market recap?
Ethereum posted the largest weekly move in absolute terms, falling 6.97%. Bitcoin also declined by 3.19%. Gold moved the other way and gained 0.91%, while EUR/USD fell 1.12%. In this group, Gold was the only market that closed the week higher.
Why do the weekly dates differ across these markets?
The crypto markets use a weekly window from 5 October 2026 to 11 October 2026. Gold and EUR/USD use a weekly window from 1 October 2026 to 9 October 2026. This recap keeps each market on the exact window reported in the source data, rather than forcing one calendar range on every asset.
Where can I follow the same framework during the week?
You can use the chart reading hub to follow the same structure between weekly recaps. It keeps the focus on daily closes, nearest reference levels, timeframe context, and hypothetical model-tracked outcomes.