Risk Management Per Trade: a simple guide to structured chart setups
Data as of 2026-10-10 23:59 UTC · Levels and zones: Znorva analysis engine
risk management per trade is the rule set that tells you when a setup became active, where the stop level belongs, and how the outcome is recorded. This guide uses Znorva data stamped 2026-10-10 23:59 UTC. The goal is consistency. One setup should not change the way you read the next chart.
What it is
This approach starts with structure. You define a reference level, wait for a liquidity sweep, confirm a reclaim, and only then track a setup. If the rule set is not complete, the scenario can be invalidated before becoming active.
R = the distance between the reference entry and the model's stop level. It gives one common unit across markets and timeframes. A 1.21 R outcome on gold can sit in the same record as a setup on Bitcoin, even though the price scales are different.
That matters because a neat-looking chart is not enough. The method needs the same outcome language every time: target reached, partial outcome, resolved at the model's stop level, invalidated, expired, or in progress. The core terms, including reclaim and liquidity sweep, are explained in the methodology.
How to spot it on a chart
Start with the nearest reference levels. These are previous day, week, or month highs and lows. They give the chart a clear level where liquidity can be swept and then reclaimed.
Next, look for a liquidity sweep. A sweep by itself does not confirm the scenario. The model needs a reclaim, which means 2 completed closes back beyond the reference level. That is the line between a simple breach and a level that the chart has taken back.
After that, the chart needs a usable zone. Znorva checks zones in a fixed order: BPR first, then IFVG, then FVG. Using the same order each time keeps the chart reading steady. A visual walk-through is on AI chart analysis, and the role of reference prices and stop levels is shown in support, resistance, reference prices, and stop levels.
How Znorva AI uses it (the method)
The sequence does not change. First, a reference level is swept. Second, the model waits for a reclaim with 2 completed closes back beyond that level. If that step never appears, the scenario can be invalidated before becoming active.
If the reclaim is confirmed, the model looks for the best available zone using the priority from the data: BPR, then IFVG, then FVG. The setup then became active at a reference price, the stop level defines the risk in R, and the model tracks 3 targets.
This is why the framework is useful for retail traders. It replaces guesswork with one repeatable process. The same labels are used across every tracked scenario, which makes later comparison much cleaner.
A real example from our data
The recent record shows how much filtering happens before a setup is tracked to resolution. Over the last 60 days, 17 setups were resolved under the model's rules. Of those, 3 reached their final target, 5 had a partial outcome, and 9 resolved at the model's stop level. Over the last 30 days, 990 scenarios were invalidated before becoming active.
That split is important. The method does not treat every chart as valid for tracking. Most scenarios never pass the full rule set. That helps explain why per-setup control is not only about the stop level. It also starts with saying no to charts that do not confirm the method.
The clearest example in the data is XAUUSD on the 15m timeframe in the forex market. The long-side scenario became active at a reference price of 4,114.55 on 7 October 2026. It was resolved under the model's rules on 9 October 2026 at 4,183.93. The hypothetical model-tracked outcome was target reached, and the result was 1.21 R.
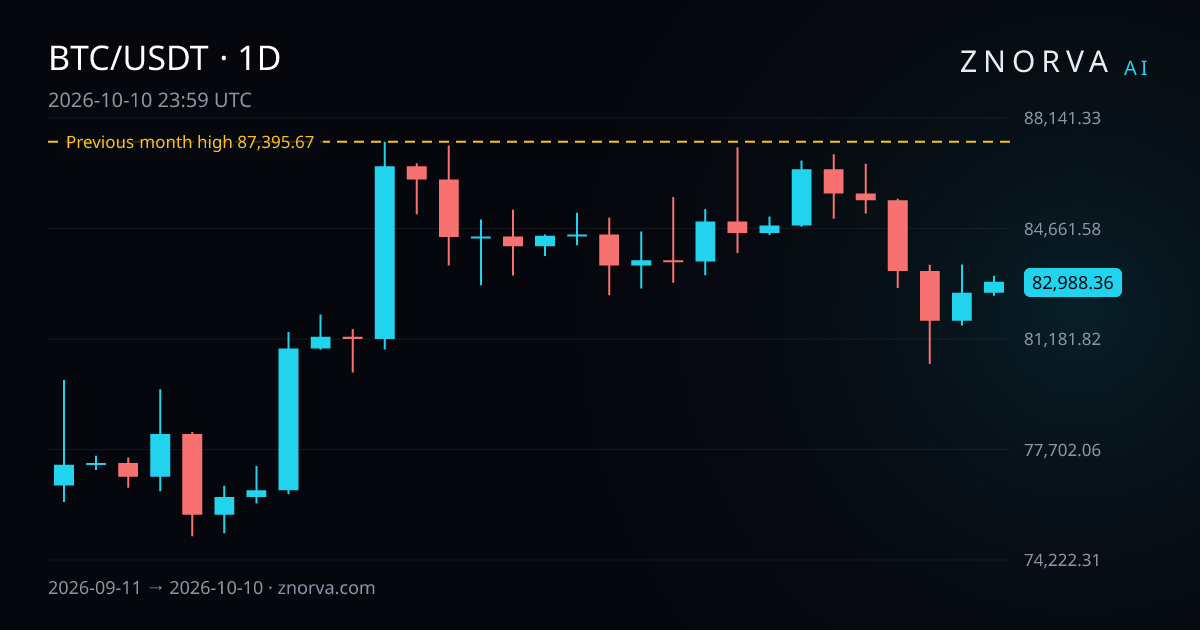
The wider context comes from Bitcoin on the 1D timeframe. The previous month high for BTCUSDT was 87,395.67, set during 1 September 2026 to 30 September 2026. From the daily close of 82,988.36 on 10 October 2026, that high sat 5.31% above. That one distance gives context without changing the lower-timeframe rules on the gold example.
Put together, the two examples show the main point. A lower-timeframe setup can be clean and still exist inside a larger map of reference levels. Good risk management per trade keeps both views aligned instead of mixing them at random.
Common mistakes
One common mistake is treating every sweep as valid. In this method, a sweep without a reclaim is incomplete. The chart still needs 2 completed closes back beyond the reference level before the setup can be tracked.
Another mistake is judging the method only by resolved outcomes. The 17 resolved setups matter, but the 990 invalidated scenarios matter too. They show how much screening happens before active tracking begins.
A third mistake is ignoring market structure differences between spot and futures charts. Those differences can change how a sweep or reclaim looks around a reference level. This guide to spot and futures chart differences adds useful context.
FAQ
How does risk management per trade help compare setups?
It creates one standard record. The same rules decide when a setup became active, where the stop level sat, and how the outcome was logged. In the recent sample, that made 17 resolved setups comparable, including 3 that reached their final target, 5 partial outcomes, and 9 that resolved at the model's stop level.
What does invalidated mean in this method?
It means the analytical scenario failed before becoming active. The chart did not complete the rule set required by the model. In the supplied data, 990 scenarios were invalidated over the last 30 days, which shows how much filtering happens before active tracking begins.
Why does the method use both R and three targets?
R gives one common unit because it measures the distance between the reference entry and the model's stop level. The 3-target structure then shows how far the setup progressed under the same rules. Together, those two parts make outcomes easier to compare across markets and timeframes.