Fair Value Gap Explained: What It Is and How Znorva AI Uses It
Data as of 2026-10-09 23:59 UTC · Levels and zones: Znorva analysis engine
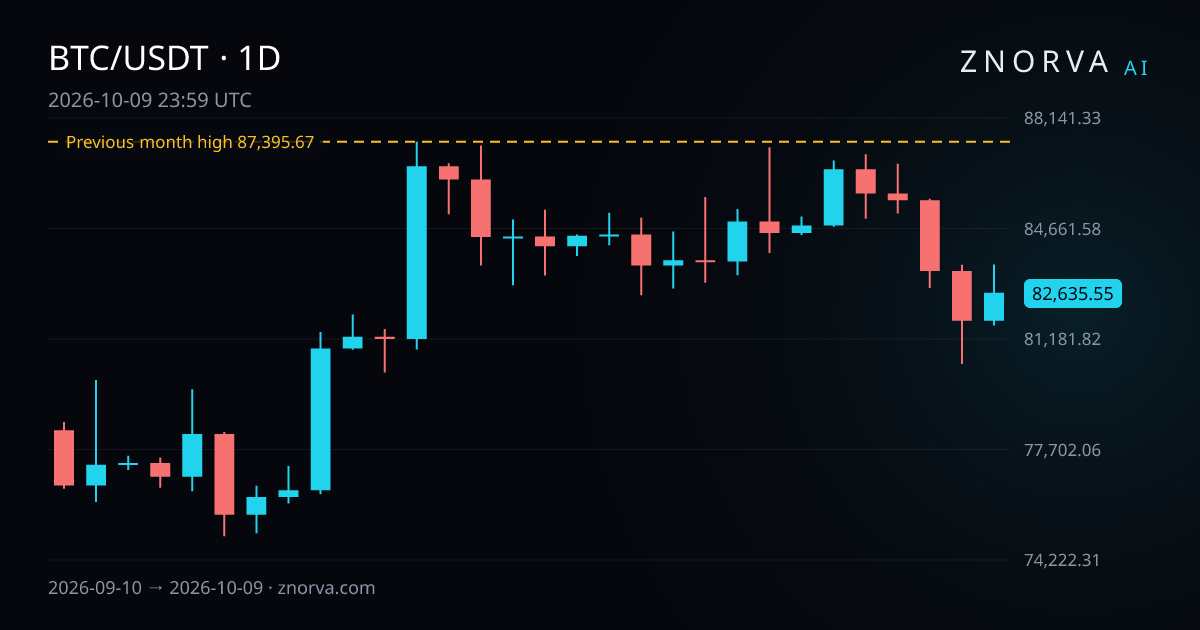
Fair value gap explained means understanding why a fast move can leave an imbalance on the chart. Traders track that area because price can react when it returns. This guide shows what the pattern is, how to spot it, and how Znorva AI uses it in a rules-based method. Data timestamp: 2026-10-09 23:59 UTC.
What it is
A fair value gap is a zone left by a fast directional move. In simple terms, price moved through that area so quickly that the chart shows an imbalance. When price returns, traders watch to see whether the move pauses, continues, or rejects from that zone.
The key point is context. A gap in the middle of messy movement can matter less than a gap that forms near a reference level, such as a previous day, week, or month high or low. That is why many traders use the idea with liquidity and structure, not on its own.
If you already follow smart money concepts, liquidity, and market structure, a fair value gap fits naturally into that chart reading process. It is not a magic pattern. It is a location where the market may rebalance after moving too quickly.
How to spot it on a chart
Start by looking for a clean push in one direction. The easier the move is to see, the easier it is to mark the imbalance it leaves behind. If the move looks weak or mixed, the zone often carries less meaning.
Next, check where that move happened. A fair value gap becomes more useful when it forms after price interacts with a reference level. Examples include a previous day high, previous week low, or previous month high. That link to structure gives the zone a reason to matter.
Then step back and compare it with the higher timeframe. A zone can look important on a fast chart and much less important on a broader chart. That is where multi-timeframe chart reading helps. It keeps you from treating every imbalance as the same kind of setup.
The return into the zone matters too. A sharp reaction back out of the area can mean something very different from a slow drift through it. The pattern itself is simple. The surrounding structure is what gives it meaning.
How Znorva AI uses it (the method)
Znorva AI does not treat every fair value gap as a setup. In the methodology, the process starts with a liquidity sweep of a reference level. After that, price must make a reclaim, which means 2 completed closes back beyond the level.
Only then does the engine rank the available zone types for the scenario. The priority order is BPR first, then IFVG, then FVG. That means a fair value gap is part of the method, but it is not always the highest-priority zone when another qualifying imbalance is present.
The model tracks 3 targets for each setup. It also records whether a scenario became active, was invalidated before becoming active, or resolved under the model's rules. In the current data sample, the tracked outcomes include target reached, partial outcome, and resolution at the model's stop level.
R is the distance between the reference entry and the model's stop level. That makes model-tracked outcomes easier to compare across different charts. So +1.21 R means the outcome covered 1.21 times that distance.
You can see the same rules-based chart reading in Znorva's AI chart analysis. The goal is not to label every gap as important. The goal is to decide whether the gap appeared after the right structural event and whether it sits in the right sequence inside the model.
A real example from our data
A clear reference-level example comes from Bitcoin on the 1D timeframe. The nearest reference level here is the previous month high. That level is 87,395.67, and the previous month runs from 1 September 2026 to 30 September 2026.
From the daily close of 82,635.55 on 9 October 2026, that nearest reference level is 5.76% above. This is useful context for fair value gaps because a gap near a known calendar high or low can carry more weight than one that forms in open space.
The setup example in the data comes from XAUUSD in forex on the 15m timeframe. It was a long-side scenario. It became active at a reference price of 4,114.55 on 7 October 2026 and was resolved under the model's rules on 9 October 2026 at 4,183.93. The hypothetical model-tracked outcome reached its final target at 1.21 R.
The recent sample helps show how selective the method is. Over the last 60 days, 17 setups resolved under the model's rules. Of those, 3 reached their final target, 5 had a partial outcome, and 9 resolved at the model's stop level. Over the last 30 days, 988 scenarios were invalidated before becoming active.
Common mistakes
The first mistake is treating every fair value gap as meaningful. A gap without a sweep, a reclaim, or a nearby reference level can be little more than chart noise. In Znorva AI's method, structure comes first and the gap is judged after that.
The second mistake is ignoring timeframe context. A zone that looks clean on a fast chart can lose importance when a higher timeframe shows price moving into a larger opposing area. That is why the method relies on sequence and context, not only on the gap itself.
Another mistake is reading only the setups that reached their final target. The data also shows partial outcomes, stop-level outcomes, and a large number of invalidated scenarios. That wider view gives a more accurate picture of how a rules-based model behaves.
FAQ
Is a fair value gap only for forex?
No. It is a chart concept, not a forex-only concept. In this data, the model setup example is XAUUSD in forex, while the reference-level example is Bitcoin on the 1D timeframe.
Does Znorva AI use every fair value gap it finds?
No. The engine first needs a liquidity sweep and then a reclaim with 2 completed closes back beyond the reference level. After that, it ranks BPR first, then IFVG, then FVG.
Why does the method use R?
R standardizes the outcome. R is the distance between the reference entry and the model's stop level. That makes a result such as +1.21 R easier to compare across different setups.