EUR/USD analysis today: 1 setup resolved as price closed at 1.11404, 7 November 2026
Data as of 2026-11-06 21:59 UTC · Levels and zones: Znorva analysis engine
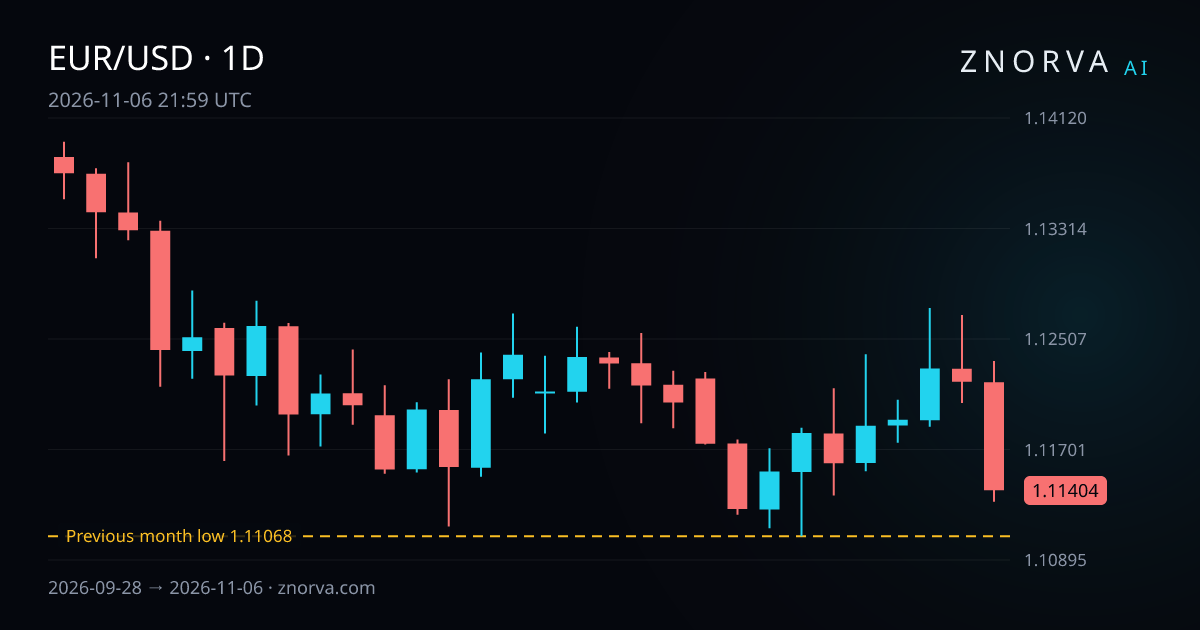
EUR/USD analysis today starts with the main fact: 1 model-tracked setup was resolved under the model's rules as the pair posted a daily close of 1.11404. The 6 November 2026 session finished down -0.71%, and this market reading uses data up to 2026-11-06 21:59 UTC.
EUR/USD price snapshot
On 6 November 2026, EUR/USD opened at 1.12192, reached 1.12347, fell to 1.1132, and closed at 1.11404. That session range was 0.92%. The close came near the day's low and well below the open.
Across the last 7 sessions, from 29 October 2026 to 6 November 2026, EUR/USD moved from an open of 1.11537 to a close of 1.11404. In that span, the highest price was 1.12734, the lowest price was 1.11068, and the net change was -0.12%.
The wider 30-session span runs from 28 September 2026 to 6 November 2026. Its high was 1.13947 and its low was 1.11068. That leaves the latest daily close close to the lower end of the recent range rather than the upper end.
Nearest reference levels and zones
This snapshot has only 1 listed reference level and no active zones. There are also no recorded liquidity sweeps in the latest data, so there is no fresh reclaim structure on the chart right now.
- Nearest reference level: previous month low at 1.11068
- Position versus the daily close: below
- From the daily close of 1.11404, the nearest reference level is 0.3% away
- Demand zones: none
- Supply zones: none
That makes the map very narrow. With no demand zone and no supply zone, the previous month low is the clearest nearby structure in the engine's view.
What changed since yesterday?
The main shift from 5 November 2026 to 6 November 2026 was a clear step lower. On 5 November 2026, EUR/USD opened at 1.12291, printed a high of 1.12683, a low of 1.1204, and closed at 1.12195. On 6 November 2026, the pair posted a lower high at 1.12347, a lower low at 1.1132, and a lower close at 1.11404.
The 24-hour close change was -0.71%, and the latest session range was 0.92%. No nearest reference levels were touched in that update window. No new zones were added over the last 48 hours.
Model activity also shifted lower rather than higher. In the last 24 hours, 1 setup was resolved under the model's rules, 0 became active, and 1 was invalidated before becoming active. There are now 0 setups in progress.
Model-tracked outcomes
Model-tracked outcomes are hypothetical analytical results, not executed trades or customer results. Znorva does not execute trades.
Over the last 30 days, the engine logged 7 resolved setups on EUR/USD. Of those, 1 reached its final target, 5 produced a partial outcome, and 1 resolved at the model's stop level. Net result: 4.25 R. R is the distance between the reference entry and the model's stop level.
The recent resolved record shows how those outcomes were distributed:
- 1H short-side scenario: became active on 5 November 2026 at a reference price of 1.12504 and resolved on 6 November 2026. Outcome: reached its final target for 2.44 R.
- 1H short-side scenario: became active on 3 November 2026 at a reference price of 1.12036 and resolved on 4 November 2026. Outcome: resolved at the model's stop level for -1 R.
- 15m long-side scenario: became active on 28 October 2026 at a reference price of 1.1123 and resolved on 28 October 2026. Outcome: partial outcome for 0.93 R.
- 15m long-side scenario: became active on 23 October 2026 at a reference price of 1.11975 and resolved on 26 October 2026. Outcome: partial outcome for 1.52 R.
- 1H short-side scenario: became active on 21 October 2026 at a reference price of 1.12298 and resolved on 21 October 2026. Outcome: partial outcome for 0.13 R.
Outside those resolved cases, the model marked 47 setups as invalidated before becoming active and 29 as expired without becoming active in the same 30-day window. That is a high filter count compared with only 7 resolved setups, which helps explain why the engine has no active EUR/USD scenario at this snapshot.
How Znorva AI reads this market
Znorva starts with reference levels, liquidity sweeps, and reclaim rules. Those reference levels come from previous day, week, or month highs and lows. If a level is swept and price prints 2 completed closes back beyond it, the engine treats that as a reclaim. It then tracks the setup with 3 targets and reviews results across 7-day and 30-day windows.
In this EUR/USD snapshot, that process is currently producing a simple map. No sweep is recorded, no zone is active, and no setup is in progress. The reading is therefore centered on whether price holds above the previous month low at 1.11068 or creates a fresh structure around it.
If you want the broader framework, the AI forex analysis guide explains how the engine organizes forex charts. The live AI chart analysis uses the same structured format, and the EUR/USD, GBP/USD, and gold market recap shows how the same rules are applied across related markets.
FAQ
What does EUR/USD analysis today show at the close?
It shows a daily close at 1.11404 after a -0.71% session on 6 November 2026. It also shows that 1 model-tracked setup was resolved and that no setup is in progress now.
Why does the previous month low matter?
It is the only listed nearest reference level in this snapshot. From the daily close of 1.11404, it is 0.3% below, so it stands out more because there are no active zones on the chart.
How should I read the recent model outcomes?
Read them as the model's recent record on EUR/USD. Over the last 30 days, the engine logged 7 resolved setups for 4.25 R net, with 1 final target, 5 partial outcomes, and 1 stop-level resolution.